Question 1. A man has $10,000 in his pocket. He could use it to buy a piece of gold and sell it after two years for $10,500. Alternatively, he could put money in a bank for two years and earn 2% a year on the funds he has deposited in the bank. Assume that the man will keep all funds in the bank the entire two years. Comparing the two options available to this man, what is the difference in his returns after 2 years?
a. $0
b. $100
c. $404
d. $96
Question 2. Suppose a freeze in Econland wipes out 20 percent of the orange crop. Simultaneously there is a huge increase in the number of international students this year, and each new student needs to buy oranges. In the market of Econland oranges, the new equilibrium price ______, and the new equilibrium quantity ______.
a. Cannot be determined, will decrease
b. Will decrease, cannot be determined
c. Will decrease, will increase
d. Will increase, cannot be determined
Question 3. Which of the following statements is an example of positive statement?
a. People are not supposed to take income into consideration when planning children.
b. Poor people should have fewer children.
c. Rich people have more children than poor people do.
d. Rich people ought to have more children.
Question 4. The diagram below shows the relationship between fertility rates and gross domestic product (GDP) per person in different countries. Is this cross-sectional or time-series data? What is the relationship between the fertility rate and GDP?
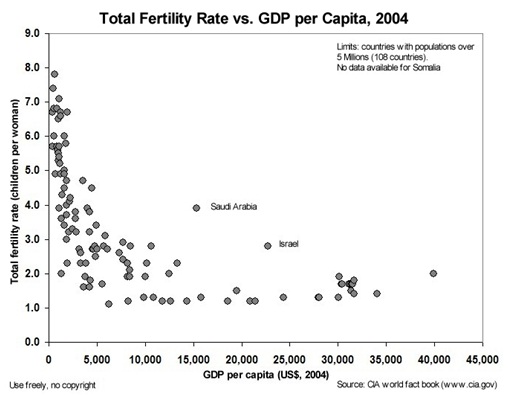
a. Cross sectional, inverse
b. Time series, inverse
c. Cross sectional, direct
d. Time series, direct
Use the information below to answer the next FOUR (4) questions.
The domestic demand for Havarti cheese in the United States is given by Q = 50 – P, and the domestic supply (most of it is made in Wisconsin!) is Q = –10 + 2P. The world price of Havarti cheese is $10 per pound (there is a huge production in Denmark).
Question 5. If the free trade were allowed in this market, how many pounds of cheese would the United States import?
a. 30 pounds
b. 35 pounds
c. 40 pounds
d. 50 pounds
Question 6. If the United States government were to impose a tariff of $5 per pound of cheese, how many pounds of cheese would be imported?
a. 30 pounds
b. 15 pounds
c. 10 pounds
d. 25 pounds
Question 7. What would be the tax revenue that the US government would collect from a tariff of $5 per pound of cheese?
a. $5
b. $25
c. $50
d. $75
Question 8. Which of the following are true statements about how the tariff affects surplus relative to free trade? [Hint: there is no need to calculate the surpluses.]
a. Consumer surplus increases with the tariff; producer surplus decreases with the tariff
b. Consumer surplus decreases with the tariff; producer surplus increases with the tariff
c. Consumer surplus increases with the tariff; producer surplus decreases with the tariff
d. Consumer surplus increases with the tariff; producer surplus increases with the tariff
Question 9. Imagine you are a high school graduate choosing between two similarly ranked universities after gaining admission into both (these are your two best choices). The costs of attending these universities are provided in the table below. Now that the application process is over, what is the opportunity cost of going to University A?
University A University B
Application fee 100 80
Books 2000 2000
Tuition 30000 10000
Housing 20000 25000
Board 15000 13000
Transport 5000 2000
a. Foregone wages plus $52,080
b. $72,100
c. $20,000
d. $20,020
Question 10. Suppose an economy produces two goods: tea (T) and coffee (C). The production possibility frontier for this economy is described by the equation: 15T - 300 = -10C. What is the horizontal intercept when this equation is graphed with coffee on the horizontal axis and tea on the vertical axis?
a. 20
b. -30
c. 30
d. -20
Use the information and graph below to answer the next TWO (2) questions.
The corn market is initially in equilibrium but corn farmers convince the government that the market price is too low. Thus, the government institutes a price support at a price of $20. The supply and demand in the corn market, as well as the equilibrium price and quantity are shown on the graph below.
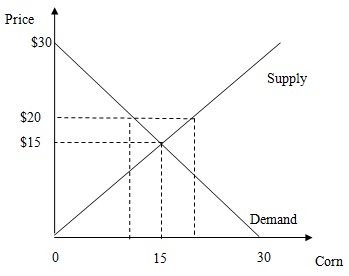
Question 11. Assume that there are no storage costs. The cost of this program to the government will be
a. $100
b. $300
c. $150
d. $200
Question 12. Assume that there are storage costs. If the total cost of the program is $400, what is the storage cost per unit?
a. $10
b. $15
c. $20
d. $25
Question 13. Imagine this is the final for Econ 101. You have managed to achieve 50/100 and 70/100 on the first two midterms, which each make up 25% of your grade. The remaining 50% is decided by the final. To get 80% for the course, how much would you need to earn on the final exam out of a hundred possible points?
a. 100
b. 80
c. 120
d. 95
Question 14. Irina consumes two goods, oranges and pineapples. When the price of oranges increases, the demand curve for pineapples shifts to the left; in this case, oranges and pineapples are most likely __________; and when Irina’s income decreases, she buys more oranges and less pineapples. Then oranges are __________.
a. Complements; a normal good
b. Complements; an inferior good
c. Substitutes; a normal good
d. Substitutes; an inferior good
Question 15. Consider the market for private college education. Suppose that there is an increase in the tuition charged by public colleges. What happens to the demand and supply curves in the market for private college education?
a. Demand shifts to the right; supply shifts to the left
b. Demand shifts to the right; supply does not change
c. Demand does not change; supply shifts to the left
d. Demand shifts to the left; supply shifts to the left
Use the following PPF curve to answer the next TWO questions:
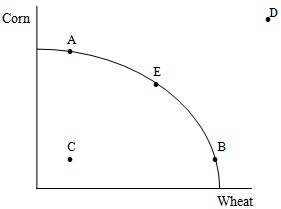
Question 16. Which statement must be true in order for the PPF to have this shape?
a. Both goods are produced with increasing opportunity cost.
b. Wheat is produced with increasing opportunity cost; corn is produced with decreasing opportunity cost.
c. There are many people producing two goods.
d. The current technology is insufficient to produce both goods.
Question 17. Which of the following statements is false?
a. Point C is not efficient and hence not feasible.
b. Points A, B, and E are efficient and more desirable than C.
c. Points A, B, C and E are feasible.
d. Of the given points in the graph, point D is the most desirable point.
Use the following demand schedule for Professor Kelly’s cookies in Econ 101 to answer the next THREE (3) questions.
Cookies (in dozens) Price
20 2
8 5
0 7
Question 18. Which of the following equations best represents the demand curve for Professor Kelly’s cookies? Assume that P is the price per dozen cookies and Q is the quantity of cookies measured as dozens of cookies.
a. P = -(1/4)Q + 7
b. P = -4Q + 7
c. Q = -(1/4)P - 7
d. Q = -4P – 7
Question 19. Suppose that Professor Kelly supplies cookies according to the following equation: P = 2Q – 2. Now the teaching assistants decide to participate in the baking of cookies. They jointly produce 1 dozen cookies at every level of price. What would be the new market supply equation?
a. P = 2(Q+1) – 2
b. P = 2Q – 1
c. P = 2Q + 4
d. P = 2Q - 4
Question 20. Students from the morning lecture learn about the cookies. This causes the demand for cookies to increase. Further, the price of milk falls due to a new government policy. Notice that milk is commonly consumed with cookies, and is also an important ingredient in baking cookies. Holding everything else constant, which of the following statements must be true?
a. Given the above information, we know that the demand curve shifts to the right causing a movement along the supply curve; the supply curve does not move.
b. Given the above information, we can conclude that the equilibrium quantity after these changes is greater than the initial equilibrium quantity while the effect on the equilibrium price after these changes is indeterminate
c. Given the above information, we can conclude that there is a shift in the demand curve to the right and a shift in the supply curve to the right: since both shifts are to the right we know that price and quantity increase in this market.
d. Given the above information, we can conclude that the model of supply and demand is not a very effective model since a model to be useful must provide unambiguous answers.
Question 21. Consider the market for air conditioners in Wisconsin, with demand given by P = 40 – Q and supply given by P = 2Q + 10. Lobbyists for air conditioner manufacturers convince the Wisconsin state government to set a price floor of $36 in the market. Which of the following statements is true?
a. There will be a surplus of 11 air conditioners.
b. There will be a surplus of 9 air conditioners.
c. There will be a shortage of 9 air conditioners.
d. There will be a shortage of 11 air conditioners.
Use this information to answer the next TWO (2) questions.
Consider the market for AT&T mobile phones, where demand for phones is Q = 16 – P and supply is Q = -14 + 2P. Suppose AT&T introduces a new look for its mobile phones. It becomes a new fashion and consumers feel that it is cool to own a new AT&T, and the demand for AT&T phones shifts by 3 phones at each price.
Question 22. What are the equilibrium price and quantity in the market for AT&T mobile phones after the demand shift?
a. P = $11, Q = 8
b. P = $10, Q = 6
c. P = $11, Q = 9
d. P = $9, Q = 4
Question 23. What is the change in the consumer and producer surplus after the demand shift?
a. CS increases by $7, PS does not change
b. CS increases by $32, PS increases by $16
c. CS increases by $3, PS decreases by $3
d. CS increases by $14, PS increases by $7
Question 24. A price ceiling is imposed by the state government on the rental price of apartments in Madison. This price ceiling is effective and results in an excess demand (shortage) for apartments of 4 units. If the demand for housing is given by the equation P = 30 – 3Q and the supply of apartments is given by the equation P = Q + 2, then the price ceiling that the state government set must be equal to
a. $12
b. $9
c. $6
d. $3
Use the information below to answer the next TWO (2) questions.
Consider the market for bicycles. The government decides to start a subsidy program which guarantees sellers a price of $60 for every bicycle. The demand in this market is given by P = –Q + 70 and the supply in given by P = 2Q + 10.
Question 25. Given this subsidy program, how many bicycles will be produced and what will be the total cost of the subsidy program to the government?
a. 30 bicycles will be produced and the subsidy cost will be $375.
b. 25 bicycles will be produced and the subsidy cost will be $450.
c. 30 bicycles will be produced and the subsidy cost will be $450.
d. 25 bicycles will be produced and the subsidy cost will be $375.
Question 26. How many bicycles will have to be purchased by the government given this subsidy program?
a. 15 bicycles
b. 20 bicycles
c. 0 bicycles
d. 5 bicycles
Use the information below to answer the next TWO (2) questions.
The residents of Mapleburgh really love their maple trees. Each spring they hold a special market where the nurseries supply saplings according to the equation P = 10 + Q. The demand for new trees is P = 40– Q. The government of Mapleburgh does not like the annual expansion of the low quality maple groves. It decides to limit the amount of new plants by introducing a quota of 5 trees that can be sold each year. To implement the quota, the government requires that the nurseries purchase selling permits. (Hint: this question is about a quota where the quota is a quantity control imposed by the government. This is like the question about haircuts on homework #3 or the example of New York taxis in your text.)
Question 27. How much will the government charge for a permit to implement this quota?
a. $25 per tree
b. $10 per tree
c. $20 per tree
d. $30 per tree
Question 28. What is the amount of deadweight loss associated with this quota?
a. $225
b. $200
c. $100
d. $0
Question 29. Cinderella takes an hour to clean a room, and an hour to cook a meal. Prince Charming takes three hours to clean a room and 'X' hours to cook a meal. What value of 'X' would NOT encourage Cinderella and Prince Charming to specialize? (i.e., no economic love between the fairy tale couple)?
a. 2
b. 3
c. 1
d. 4
Use this information to answer the next THREE (3) questions.
Hunky and Dory are two close friends who both decide to go and live on a paradise island, producing fish and bread for survival. Below is their daily production schedule showing the maximum amount of each good they can produce from their resources if they only produce that good (for example, the maximum amount of bread Hunky can produce is 10 loaves and when he produces these ten loaves he produces 0 fish). Assume that both Hunky and Dory have linear production possibility frontiers. (Hint: if you draw the PPFs for these two individuals you will find it helpful to measure bread on the vertical axis and fish on the horizontal axis.)
Units of Bread Units of Fish
Hunky 10 8
Dory 5 2
Question 30. Which of the following statements is false?
a. Hunky has a comparative advantage in the production of both goods.
b. Dory does not have an absolute advantage.
c. Hunky has an absolute advantage in the production of fish.
d. Dory has a comparative advantage in the production of bread.
Question 31. What is the range of fish prices that would make trade between Hunky and Dory possible?
a. Between 0.4 and 0.8 loaves of bread
b. Between 1.25 and 2.5 loaves of bread
c. Between 5 and 10 loaves of bread
d. Between 0.4 and 2.5 loaves of bread
Question 32. If the production possibility frontiers for Hunky and Dory are assumed to be straight lines, and we draw the joint PPF for the two of them, what would be the co-ordinates of point X on the graph? (The graph is NOT drawn to scale.)
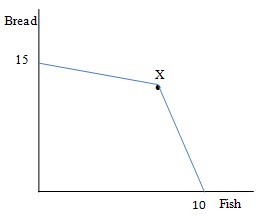
a. (8, 5)
b. (10, 5)
c. (10, 8)
d. (2, 10)
Question 33. The global tea crop gets wiped out by a serious plant virus. Holding everything else constant, what would happen in the tea market given this change?
a. Equilibrium price moves upward along the demand curve as equilibrium quantity falls.
b. A sharp movement along the demand curve results in an increase in equilibrium quantity.
c. A drastic shift in supply results in a large drop in the equilibrium price.
d. Equilibrium price and quantity both move downward along the supply curve.