Question 1) Consider the budget line depicted below:
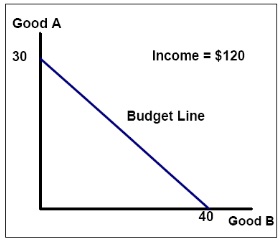
a) What is the price of good A?
b) What is the price of good B?
c) Write the equation of the line in slope - intercept form . What is the slope of the budget line?
d) How is the slope of the budget line related to the ratio of the two prices?
Question 2) Suppose Mike Myers consumes only leather jackets and guitars. He has an income of $10,000. Jackets cost $400 each, while the price of guitars is $2,000 each. On a separate graph for each part below show how each of the following changes affects Mike’s budget line. On your graphs, put jackets on the horizontal axis and guitars on the vertical axis. L abel your graphs carefully and completely. On your graphs show the initial budget line, BL1, as well as the new budget line, BL2.
a) Due to an increase in sales of Mini - Me dolls, Mike’s income increases by 20% .
b) Due to the eminent retirement of Eric Clapton, the price of guitars increases by $500 each, (even the unsigned ones) .
c) Mike’s income increases by 20%, the price of guitars increases by $1,000, and the price of jackets decreases by $100, all at the same time.
Question 3) This exercise will sharpen your skills with income and substitution effects. Draw a preliminary graph with whippers on the y - axis and snappers on the x - axis. On this graph include a generic budget line and a set of normal indifference curves that are downward sloping and bowed in (convex) toward the origin (convex) . For each of the following situations, redraw the preliminary graph you ’ ve just designed and as explicitly as possible de monstrate the following changes. (HINT: you will need to adjust your indifference curves in order to illustrate the following scenarios!) On your graphs you will want to indicate the size and direction of t he income and substitution effects as well as the location of the intermediate point (Professor Kelly refers to this as “Point C” in her examples) used to calculate the income and substitution effects.
a) Price of whippers decreases, both whippers and snappers are normal goods
b) Price of whippers increases, whippers are a normal good, snappers are inferior
c) Price of snappers increases, whippers are normal and snappers are inferior goods
d) Price of snappers in creases, bo th whippers and snappers are normal goods
Question 4) Consider the market for light bulbs. Write your own (linear) d emand equation for light bulbs (Q) as a function of income, price of light bulbs & the price of lamps. It should satisfy the law of the demand, but other than that you are free to exercise yo ur creativity. Hint: there are an infinite number of possible equations - your equation will likely be different from other students’ equations. Use this equation to answer the following questions:
a) What is the income elasticity of demand for light bulbs? Wh at does that tell you? (Hint: to find the income elasticity of demand for light bulbs, use the point elasticity formula but modify it to consider the relationship between income and quantity rather than price and quantity.)
b) What is the cross - price elasticity of demand for light bulbs (with respect to lamps)? What type of good are light bulbs? (Hint: to find the cross - price elasticity of demand for light bulbs with respect to lamps use the point elasticity formula but modify it to consider the relationship between the price of lamps and the quantity of light bulbs rather than the relationship between the price of light bulbs and the quantity of light bulbs.)
Question 5) Use the following information to answer the next four questions: The following table gives cost information for a firm. Assume that labor is paid a constant wage, i.e. our firm is a price - taker in the labor market
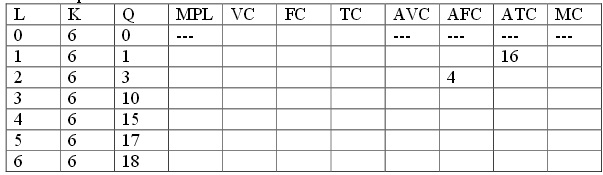
a) Complete the table with specific values.
b) Suppose output is equal to zero. Why does the firm still incur costs in the short run when output is equal to zero? What is the fixed cost of this firm? What is the price of a unit of capital? What is the wage rate?
c) At what level of labor usage does the law of diminishing returns first occur?
Question 6) Johnny Joe's is a burrito store that wants to raise their total revenue. The staff can identify customers as freshmen or upperclassmen, but other than that they all look the same. Currently all burritos are $6 each. Johnny Joe's is thinking of chang ing the price to $3 per burrito. Having studied the market for burritos, Johnny Joe knows how consumers are likely to respond to the price change and has provided you this information in the table below:
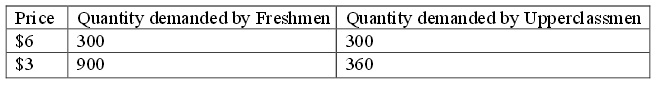
a) What is the price elasticity of demand for each of these groups, using the midpoint method?
b) What is Johnny Joe's total revenue at the current price of $6/burrito? What is Johnny Joe’s total revenue at a price of $3/burrito?
c) What is Johnny Joe's total revenue if they charge upperclassmen $3/burrito and they charge freshmen $6/burrito? What is Johnny Joe’s total revenue if they charge upperclassmen $6/burrito and they charge freshmen $3/burrito?
d) Which of the pricing schemes considered yielded the highest total revenue? Explain why this is best pricing scheme for John ny Joe's to use in order to maximize total revenue
Question 7) Bret Bielema only eats beef jerky. In his first year as UW Head Coach, Slim Tims cost $1 apiece, while Jack Winks were $2 each. That year, Coach Bielema at e 1,000 Slim Tims. In his second year as Head Coach, Slim Tims cost $2 each, while Jack Winks were only $1 each. That year Coach Bielema ate 1,000 Jack Winks.
a) Compute a price index for beef jerky for each year - the basket should include 2 Slim Tims and 2 Jack Winks. Assume Coach Bielema's first year as coach is the 'base year'. How does the index change from one year to the next?
b) Compute Coach Bielema's nominal spending on beef jerky each year. How does it change from year to year?
c) Compute Coach Bielema' s real spending on beef jerky each year. How does it change over time?
Question 8:
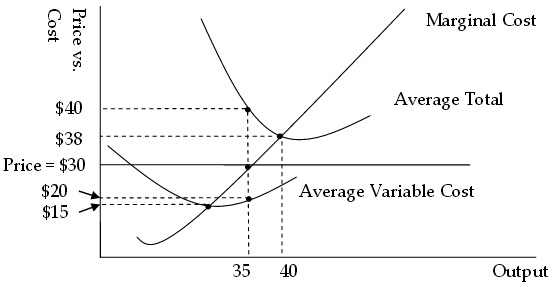
The following graph shows the production cost curves of a firm in a perfectly competitive industry. Assume that the firm is a price - taker and the equilibrium price equals $30 in the short run. (Hint: According to the gr aph, we can tell the firms are producing 35 units of the good.)
a) In the short run, how much is the Total Cost for this company at the profit maximizing level of output?
b) In the short run, will the firm make a positive economic profit or a negative economic profit? Calculate the value of profits for this firm in the short run. Will the firm continue to operate in the short run or will it shut down?
c) Given the information above, calculate the fixed cost of production for this firm. Then, calculate the variabl e cost of production if the firm produces 35 units of the good. Finally, calculate the variable cost of production if the firm produces 40 units of the good.
d) What is the break - even price for the firm given the above graph ? What is the shut - down price fo r the firm given the above graph ?