A comparison of the Power 5 Conferences resulted in measuring differences in passing, rushing, total, and points per game. The purpose of this test was to determine which of the Power 5 Conferences were the best. The Power 5 Conferences include the South Eastern Conference, the Atlantic Coastal Conference, the Big Twelve, the Big Ten, and the Pacific Twelve. Four different graphs were made to show the differences in passing, rushing, total, and points per game. The offensive and defensive data statistics came from espn.go.com/college-football/conferences/statisticsiteamUstatitotal/year/2014/id/Vsec-conference.
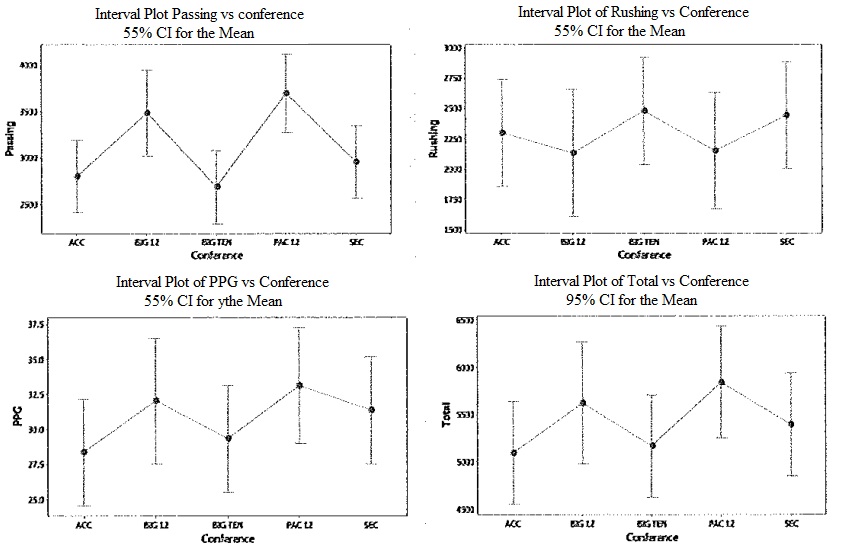
The statistical test that is appropriate is the one-way anova because it compares the means of three or more groups. The significance level is assumed to be 0.05, The degrees of freedom for each test is 4. The first step is determining the null and alternative hypothesis. The null hypothesis is that the average yardage for the passing, rushing, total, and points per game are equal. The alternative is that at least one is different from the others.
The next step is when the test statistic is calculated. Using the following formula SSTrt = Σnj(xj - x‾)2 results in the treatment. In order to make a decision, a comparison of the p value and alpha is needed. Since alpha is assumed 0.05 and the p value is .003, reject the null hypothesis to conclude that the alternative is true, There is sufficient evidence that average passing yards between the Conferences are different.
SS DF MS Fstatistic Pvalue
Conference 9697724 4 2424431 4.51 .003
Error 31739544 59 537958
Total 41437268 63
To find the sums of squares (SS) for rushing yardage, correctly putting the information in Minitab will result in a table like this one. Compare the p value at 0.759 to alpha at 0.05 and it is assumed to fail to reject the null hypothesis.
SS DF MS Fstatistic Pvalue
Conference 1276130 4 319032 0.47 0.759
Error 40273169 59 682596
Total 41549298 63
To find the sums of squares (SS) for total yardage, correctly putting the information in Minitab will result in a table like this one. it is assumed to fail to reject the null hypothesis because the p value is 0.329 and alpha being 0.05.
SS DF MS Fstatistic Pvalue
Conference 4901620 4 1225405 1.18 0.329
Error 61325398 59 1039414
Total 66227018 63
To find the sums of squares (SS) for points per game yardage, correctly putting the information in Minitab will result in a table like this one. Compare the p value at 0.329 to alpha at 0.05 and it is assumed to fail to reject the null hypothesis
SS DF MS Fstatistic Pvalue
Conference 196.8 4 49.19 0.97 0.432
Error 2997.9 59 50.81
Total 3194.6 63
The final step is to interpret the information and make a statistical decision. Since every test, except passing yardage, resulted in failing to reject the null hypothesis, it is difficult to assume which conference is the best. An interesting aspect would be testing the defensive total yardage allowed and defensive points per game allowed.