Assignment 1:
QUESTION 1:
A computer network manager wants to test the reliability of some new and expensive fiber-optic Ethernet cables that the computer department just received. The computer department received 7 boxes containing 50 cables each. The manager does not have the time to test every cable in each box. The manager will choose one box at random and test 10 cables chosen randomly within that box. What is the population?
a) The 7 boxes
b) The 10 cables chosen randomly for testing
c) The one box that was chosen at random from the 7 boxes
d) 350 cables
QUESTION 2:
Answer the question.
The spell-checker in a desktop publishing application may not catch all misspellings (e.g. their, there) or correctly interpret the spellings of proper names. Jackie is an expert editor and can proofread extremely quickly. Jackie is hired by a book publisher to check the spelling of every word in the latest proof of a history book. With regard to Jackie's assignment, what is the population?
a) The total number of misspellings that Jackie finds in the latest proof of the history book
b) Finding misspellings in the latest proof of the history book
c) The latest proof of the history book
d) Every word in the latest proof of the history book
QUESTION 3:
Identify the sampling technique used.
To ensure customer satisfaction, every 5th phone call received by customer service will be monitored.
a) random
b) cluster
c) stratified
d) convenience
e) systematic
QUESTION 4:
Determine whether the study is an observational study or an experiment. A medical researcher obtains a sample of adults suffering from diabetes. She randomly assigns 67 people to a treatment group and 67 to a placebo group. The treatment group receives a medication over a period of three months and the placebo group receives a placebo over the same time frame. At the end of three months the patients' symptoms are evaluated.
a) experiment
b) observational study
QUESTION 5:
Identify the sampling technique used. In a recent television survey, participants were asked to answer "yes" or "no" to the question "Are you in favor of the death penalty?" Six thousand five hundred responded "yes" while 5100 responded "no". There was a fifty-cent charge for the call.
a) stratified
b) convenience
c) systematic
d) cluster
e) random
QUESTION 6:
Determine whether the given description corresponds to an observational study or an experiment.
A stock analyst selects a stock from a group of twenty for investment by choosing the stock with the greatest earnings per share reported for the last quarter.
a) Observational study
b) Experiment
QUESTION 7
Determine whether the study is an observational study or an experiment.
A scientist was studying the effects of a new fertilizer on crop yield. She randomly assigned half of the plots on a farm to group one and the remaining plots to group two. On the plots in group one, the new fertilizer was used for a year. On the plots in group two, the old fertilizer was used. At the end of the year the average crop yield for the plots in group one was compared with the average crop yield for the plots in group two.
a) observational study
b) experiment
QUESTION 8:
Determine whether the study is an observational study or an experiment.
A pollster obtains a sample of students and asks them how they will vote on an upcoming referendum.
a) observational study
b) experiment
QUESTION 9:
Answer the question.
100,000 randomly selected adults were asked whether they drink at least 48 oz of water each day and only 45% said yes. Identify the sample and population.
a) Sample: the 45% of adults who drink at least 48 oz of water; population: all adults
b) Sample: all adults ; population: the 100,000 selected adults
c) Sample: the 100,000 selected adults; population: all adults
d) Sample: the 100,000 selected adults; population: the 45% of adults who drink at least 48 oz of water
QUESTION 10:
Select the most appropriate answer.
A high school guidance counselor analyzed data from a sample of 600 community colleges taken throughout the United States. One of his goals was to estimate the annual tuition costs of community colleges in the United States. Identify the population of interest to the guidance counselor.
a) the sample of 600 community colleges
b) all high school guidance counselors
c) the average annual tuition cost of community colleges in the United States
d) all community colleges in the United States
e) all students attending community colleges in the United States
QUESTION 11:
Determine whether the summary measure is better described as a parameter or a statistic.
The average height of horse jockeys
a) Statistic
b) Parameter
QUESTION 12
Select the most appropriate answer.
A survey asks "would you like to see more or less government spending on natural disasters?" Of the 1496 respondents, 723 responded "more" or "much more". The population of interest consists of
a) the 723 respondents who responded "more" or "much more"
b) all American adults
c) the proportion of American adults who would respond "more" or "much more"
d) the 1496 respondents
e) the proportion of respondents who responded "more" or "much more"
QUESTION 13:
Select the most appropriate answer.
In a survey, 71% of 1052 adults polled answered "Yes" to the question "Do you believe the theory that increased carbon dioxide and other gases released into the atmosphere will, if unchecked, lead to global warming and an increase in average temperatures?" The sample consists of
a) 71% of American adults
b) all American adults
c) the 1052 polled adults
d) the proportion of adults polled who responded "Yes" to the question
e) the proportion of American adults who are predicted to respond "Yes" to the question
QUESTION 14:
Select the most appropriate answer.
A manufacturer of cellular phones has decided that an assembly line is operating satisfactorily if less than 6% of the phones manufactured per day are defective. To check the quality of a day's production, the company decides to randomly sample 30 phones from a day's production and test for defects. Define the population of interest to the manufacturer.
a) all defective cellular phones manufactured by the company
b) the 6% of the cellular phones that were defective
c) the 30 cellular phones that were sampled and tested
d) all cellular phones manufactured during the day in question
e) the 30 responses: defective or not defective
QUESTION 15:
Select the most appropriate answer.
In a survey, 71% of 1052 adults polled nationwide answered "Yes" to the question "Do you believe the theory that increased carbon dioxide and other gases released into the atmosphere will, if unchecked, lead to global warming and an increase in average temperatures?" The predicted proportion of all American adults who would respond "Yes" to the question is an example of
a) a parameter
b) the sample
c) a statistic
d) the population
e) random sampling
QUESTION 16:
Provide an appropriate response.
The city council of a small town needs to determine if the town's residents will support the building of a new library. The council decides to conduct a survey of a sample of the town's residents. Which one of the following procedures would be most appropriate for obtaining a sample of the town's residents?
a) Survey 500 individuals who are randomly selected from a list of all people living in the state in which the town is located.
b) Survey every 13th person who enters the old library on a given day.
c) Survey a random sample of librarians who live in the town.
d) Survey a random sample of persons within each neighborhood of the town.
QUESTION 17:
Select the most appropriate answer.
A survey asks "would you like to see more or less government spending on natural disasters?" Of the 1496 respondents, 723 responded "more" or "much more". The proportion of respondents who responded "more" or "much more" is an example of
a) a parameter
b) the sample
c) random sampling
d) a statistic
e) the population
QUESTION 18:
State whether the actual data are discrete or continuous and explain why.
The count of cars passing a certain intersection for each day of the week
a) Discrete because only counting numbers are used, and no values between the counting numbers are possible
b) Continuous because the numbers can have any value within some range of values
QUESTION 19:
Identify the data set's level of measurement.
The amounts of fat (in grams) in 29 cookies
a) ordinal
b) interval
c) nominal
d) ratio
QUESTION 20:
Identify the data set's level of measurement. number of milligrams of tar in 85 cigarettes
a) nominal
b) interval
c) ordinal
d) ratio
QUESTION 21
Determine which of the four levels of measurement (nominal, ordinal, interval, ratio) is most appropriate.
The subjects in which college students major
a) Interval
b) Nominal
c) Ratio
d) Ordinal
QUESTION 22:
Identify the data set's level of measurement.
Tthe ratings of a movie ranging from "poor" to "good" to "excellent"
a) ordinal
b) ratio
c) nominal
d) interval
QUESTION 23:
Identify the data set's level of measurement.
List of 1239 social security numbers
a) interval
b) ordinal
c) ratio
d) nominal
QUESTION 24:
State whether the actual data are discrete or continuous and explain why.
The number of phone calls made each day by the sales representative of a company
a) Discrete because only counting numbers are used, and no values between the counting numbers are possible
b) Continuous because the numbers can have any value within some range of values
QUESTION 25:
Identify the data set's level of measurement.
Manuscripts rated "acceptable" or "unacceptable"
a) ordinal
b) interval
c) nominal
d) ratio
QUESTION 26:
Identify the data set's level of measurement.
The annual salaries for all teachers in California
a) nominal
b) interval
c) ordinal
d) ratio
QUESTION 27
Provide an appropriate response.
The scores on a recent statistics test are given in the frequency distribution below. Construct the corresponding relative frequency distribution. Round relative frequencies to the nearest hundredth of a percent if necessary.
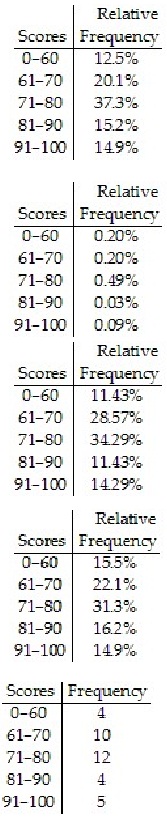
QUESTION 28:
Solve the problem.
What number is missing from the table?
Year in
College Frequency Relative Frequency
Freshman 600 .30
Sophomore 560 .28
Junior .22
Senior 400 .20
a) 440
b) 520
c) 220
d) 480
QUESTION 29:
Provide an appropriate response.
The following frequency distribution analyzes the scores on a math test. Find the class midpoint of scores interval 95-99.
Scores Number of students
40-59 2
60-75 4
76-82 6
83-94 15
95-99 5
a) 97.5
b) 98.0
c) 97.0
d) 96.5
QUESTION 30:
Provide an appropriate response.
A sample of candies have weights that vary from 2.35 grams to 4.75 grams. Use this information to find the upper and lower limits of the first class if you wish to construct a frequency distribution with 12 classes.
a) 2.35-2.75
b) 2.35-2.55
c) 2.35-2.54
d) 2.35-2.65
QUESTION 31:
Provide an appropriate response.
The frequency distribution below summarizes the home sale prices in the city of Summerhill for the month of June. Determine the class midpoint for class 235.0-265.9.
Sale price in thousand $ Frequency
80.0-110.9 2
111.0-141.9 5
142.0-172.9 7
173.0-203.9 10
204.0-234.9 3
235.0-265.9 1
a) 250.55
b) 250.50
c) 250.45
d) 250.40
QUESTION 32:
Construct the cumulative frequency distribution that corresponds to the given frequency distribution.
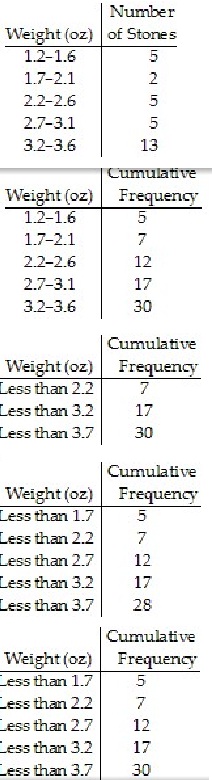
QUESTION 33
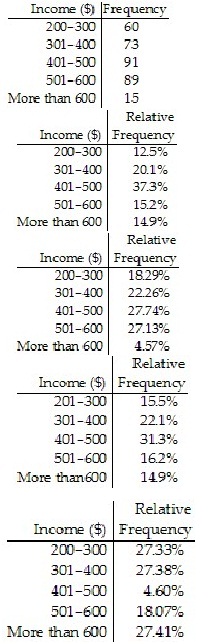
Provide an appropriate response.
The frequency distribution for the weekly incomes of students with part-time jobs is given below.
Construct the corresponding relative frequency distribution. Round relative frequencies to the nearest hundredth of a percent if necessary.
QUESTION 34:
Provide an appropriate response.
The frequency distribution below summarizes the home sale prices in the city of Summerhill for the month of June. Determine the width of each class.
Sales prive in thousands ($) Frequency
80.0-110.9 2
111.0-141.9 5
142.0-172.9 7
173.0-203.9 10
204.0-234.9 3
235.0-265.9 1
a) 31
b) 61
c) 30
d) 28
Assignment 2:
QUESTION 1:
Find the indicated probability.
A bag contains 5 red marbles, 3 blue marbles, and 1 green marble. Find P(not blue).
a) 1/3
b) 6
c) 2/3
d) 3/2
QUESTION 2:
Find the indicated probability.
100 employees of a company are asked how they get to work and whether they work full time or part time. The figure below shows the results. If one of the 100 employees is randomly selected, find the probability of getting someone who carpools, someone who cycles to work, or someone who works part time.
1. Public transportation: 9 full time, 6 part time
2. Bicycle: 4 full time, 4 part time
3. Drive alone: 35 full time, 30 part time
4. Carpool: 6 full time, 6 part time
a) 0.56
b) 0.46
c) 0.66
d) 0.2
QUESTION 3:
Find the indicated probability.
The table below describes the smoking habits of a group of asthma sufferers.
Occassional Regular Heavy
Nonsmoker smoker smoker smoker Total
Men 444 37 76 34 591
Women 429 47 86 44 606
Total 873 84 162 78 1197
If one of the 1197 people is randomly selected, find the probability of getting a regular or heavy smoker.
a) 0.458
b) 0.092
c) 0.201
d) 0.135
QUESTION 4:
Provide an appropriate response.
The table lists the drinking habits of a group of college students. If a student is chosen at random, find the probability of getting someone who is a man or a woman. Round your answer to three decimal places.
Sex Non-drinker Regular drinker Heavy drinker Total
Man 135 53 5 193
woman 187 21 7 215
Total 322 74 12 408
a) 0.789
b) 0.211
c) 0.931
d) 1
QUESTION 5
Determine whether the events are disjoint.
Read a book by Mark Twain. Read about Tom Sawyer.
a) Yes
b) No
QUESTION 6
Provide an appropriate response.
Consider the discrete probability distribution to the right when answering the following question. Find the probability that x equals 5.
x 3 5 6 8
P(x) 0.11 ? 0.02 0.12
a) 3.75
b) 0.25
c) 0.75
d) 1.25
QUESTION 7:
Solve the problem.
Consider the given discrete probability distribution. Find the probability that x equals 5.
x 3 5 7 9
P(x) 0.33 ? 0.27 0.31
a) 4.55
b) 0.09
c) 0.45
d) 0.91
QUESTION 8:
Provide an appropriate response.
The monthly telephone usage (in minutes) of 30 adults is listed below. Find the interquartile range for the telephone usage of the 30 adults.
154 156 165 165 170 171 172 180 184 185
189 189 190 192 195 198 198 200 200 200
205 205 211 215 220 220 225 238 255 265
a) 30
b) 32
c) 29
d) 31
QUESTION 9:
Find the number of standard deviations from the mean. Round your answer to two decimal places
The test scores on the Chapter 3 mathematics test have a mean of 58 and a standard deviation of 11. Andrea scored 85 on the test. How many standard deviations from the mean is that?
a) 2.45 standard deviations below the mean
b) 2.45 standard deviations above the mean
c) 0.55 standard deviations below the mean
d) 0.55 standard deviations above the mean
QUESTION 10:
Find the midrange for the given sample data.
A meteorologist records the number of clear days in a given year in each of 21 different U.S. cities. The results are shown below. Find the midrange.
72 143 52 84 100 98 101
120 99 121 86 60 59 71
125 130 104 74 83 55 169
a) 112 days
b) 110.5 days
c) 117 days
d) 98 days
QUESTION 11:
Find the number of standard deviations from the mean. Round your answer to two decimal places.
The number of assists per match for the setter on your school's volleyball team has a mean of 58 and a standard deviation of 7. How many standard deviations from the mean is an outing with 77 assists?
a) 1.36 standard deviations above the mean
b) 1.36 standard deviations below the mean
c) 2.71 standard deviations above the mean
d) 2.71 standard deviations below the mean
QUESTION 12:
Construct a boxplot for the given data. Include values of the 5-number summary in all boxplots.
The test scores of 40 students are listed below. Construct a boxplot for the data set.
25 35 43 44 47 48 54 55 56 57
59 62 63 65 66 68 69 69 71 72
72 73 74 76 77 77 78 79 80 81
81 82 83 85 89 92 93 94 97 98
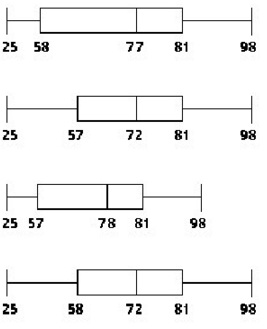
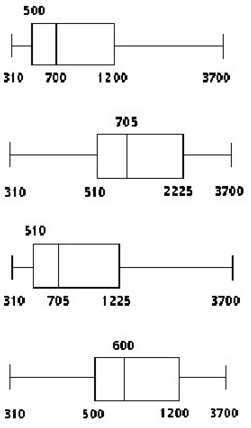
QUESTION 13:
Construct a boxplot for the given data. Include values of the 5-number summary in all boxplots.
The weekly salaries (in dollars) of 24 randomly selected employees of a company are shown below. Construct a boxplot for the data set.
310 320 450 460 470 500 520 540
580 600 650 700 710 840 870 900
1000 1200 1250 1300 1400 1720 2500 3700
QUESTION 14:
Find the sample standard deviation.
14, 15, 12, 11, 12, 16, 13, 16, 18, 18
a) 1.6
b) 2.0
c) 2.5
d) 2.3
QUESTION 15:
Find the percentile for the data value.
Data set: 4 13 8 6 4 4 13 6 4 13 2 13 15 5 9 4 12 8 6 13;
data value: 6
a) 35
b) 25
c) 40
d) 62
QUESTION 16
Find the sample standard deviation.
5, 5, 5, 8, 11, 11, 11
a) 2.8
b) 3
c) 9.0
d) 7.7
QUESTION 17:
Find the standard deviation of the data summarized in the given frequency distribution.
The manager of a bank recorded the amount of time each customer spent waiting in line during peak business hours one Monday. The frequency distribution below summarizes the results. Find the standard deviation. Round your answer to one decimal place.
Waiting time (minutes) Number of customer
0-3 9
4-7 16
8-11 15
12-15 8
16-19 0
20-23 2
a) 5.0 min
b) 7.0 min
c) 4.5 min
d) 4.8 min
QUESTION 18
Find the sample standard deviation.
42, 34, 45, 75, 90, 29, 64, 51, 29
a) 364.0
b) 404.4
c) 19.1
d) 21.3
QUESTION 19
Find the mean for the given sample data. Unless indicated otherwise, round your answer to one more decimal place than is present in the original data values. Andrew asked seven of his friends how many cousins they had. The results are listed below. Find the mean number of cousins.
18 12 7 13 7 2 7
a) 9.4 cousins
b) 8.9 cousins
c) 11 cousins
d) 10.9 cousins
QUESTION 20
Provide an appropriate response.
The percentage of measurements that are below the 88th percentile is
a) cannot determine
b) 22%
c) 12%
d) 88%
QUESTION 21
Provide an appropriate response.
Given the following five-number summary, find the IQR.
2.9, 5.7, 10.0, 13.2, 21.1.
a) 11.1
b) 7.1
c) 18.2
d) 7.5
QUESTION 22
Provide an appropriate response.
The commuting times of ten employees (in minutes) are listed below. Find the mode score.
65 66 67 66 70 67 70 71 68
a) 68 minutes
b) 65 minutes
c) 67 minutes
d) 66 minutes
QUESTION 23:
Provide an appropriate response.
The commuting times (in minutes) of an employee for ten consecutive days are listed below. Find the median commute.
71 67 67 72 76 72 73 68 72 72
a) 72 minutes
b) 71 minutes
c) 73 minutes
d) 67 minutes
QUESTION 24:
Find the variance for the given data. Round your answer to one more decimal place than the original data.
13.9 12.0 13.0 12.3 10.5
a) 1.59
b) 1.27
c) 33.32
d) 1.49
QUESTION 25:
Provide an appropriate response.
The repair costs for five cars which were crashed by a safety testing organization were as follows:
$100, $150, $200, $250, and $150. Find the mean cost of repair.
a) $170
b) $180
c) $140
d) $160
QUESTION 26:
Find the median for the given sample data.
The number of vehicles passing through a bank drive-up line during each 15-minute period was recorded. The results are shown below. Find the median number of vehicles going through the line in a fifteen-minute period.
24 26 24 27
27 24 29 26
34 30 30 28
23 30 24 19
14 26 26 26
a) 25.85 vehicles
b) 27 vehicles
c) 30 vehicles
d) 26 vehicles
QUESTION 27:
Find the sample standard deviation.
1, 2, 10, 6, 13, 10, 7, 13, 16
a) 23.1
b) 4.8
c) 5.1
d) 26.0
QUESTION 28:
Provide an appropriate response.
A club elects a president, vice-president, and secretary-treasurer. How many sets of officers are possible if there are 12 members and any member can be elected to each position? No person can hold more than one office.
a) 660
b) 11,880
c) 1320
d) 440
QUESTION 29:
Solve the problem.
How many ways can 6 people be chosen and arranged in a straight line if there are 8 people to choose from?
a) 20,160
b) 40,320
c) 720
d) 48
QUESTION 30
Evaluate the expression.
6P5
a) 0
b) 720
c) 21
d) 1
QUESTION 31:
Evaluate the factorial expression.
4!/2!
a) 2!
b) 4/2
c) 12
d) 4
QUESTION 32:
Provide an appropriate response.
License plates in a particular state display 3 letters followed by 2 numbers. How many different license plates can be manufactured? (Repetitions are allowed.)
a) 1,757,600
b) 260
c) 36
d) 6
QUESTION 33:
Provide an appropriate response.
A person can order a new car with a choice of 7 possible colors, with or without air conditioning, with or without heated seats, with or without anti-lock brakes, with or without power windows, and with or without a CD player. In how many different ways can a new car be ordered in terms of these options?
a) 14
b) 224
c) 112
d) 448
QUESTION 34:
Provide an appropriate response.
There are 9 performers who are to present their acts at a variety show. One of them insists on being the first act of the evening. If this request is granted, how many different ways are there to schedule the appearances?
a) 40,320
b) 362,880
c) 81
d) 72
QUESTION 35
Provide an appropriate response.
In a contest in which 10 contestants are entered, in how many ways can the 3 distinct prizes be awarded?
a) 86,400
b) 604,800
c) 1,209,600
d) 720
QUESTION 36:
Provide an appropriate response. Express your answer as a simplified fraction unless otherwise noted.
An ice chest contains 8 cans of apple juice, 7 cans of grape juice, 6 cans of orange juice, and 2 cans of pineapple juice. Suppose that you reach into the container and randomly select three cans in succession. Find the probability of selecting no grape juice.
3360/12167
2048/5313
5/253
80/253
QUESTION 37:
Find the indicated probability. Express your answer as a simplified fraction unless otherwise noted.
The following table contains data from a study of two airlines which fly to Small Town, USA.
Number of flights Number of flights
which were on time which were late
Podunk Airlines 33 6
Upstate Airlines 43 5
If one of the 87 flights is randomly selected, find the probability that the flight selected arrived on time.
11/76
76/87
43/87
None of the above is correct
QUESTION 38:
Provide an appropriate response.
Two events are ________________ if the occurrence of event E in a probability experiment changes the probability of event F in the same experiment.
a) disjoint
b) independent
c) mutually exclusive
d) dependent
QUESTION 39:
Find the indicated probability.
The table below describes the smoking habits of a group of asthma sufferers. If two different people are randomly selected from the 948 subjects, find the probability that they are both heavy smokers. Round to six decimal places.
Light Heavy
Nonsmoker smoker smoker Total
Men 356 50 36 442
Women 418 43 45 506
Total 774 93 81 948
a) 0.007301
b) 0.001442
c) 0.0001524
d) 0.007218
QUESTION 40:
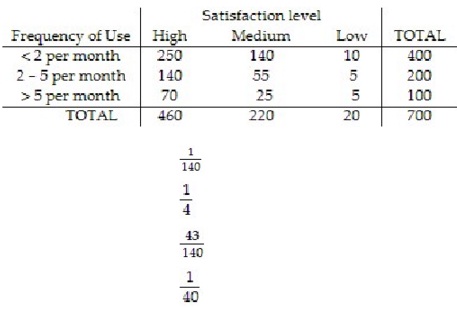
Provide an appropriate response. Express your answer as a simplified fraction unless otherwise noted.
The overnight shipping business has skyrocketed in the last ten years. The single greatest predictor of a company's success has been proven time and again to be customer service. A study was conducted to study the customer satisfaction levels for one overnight shipping business. In addition to the customer's satisfaction level, the customers wer asked how often they used overnight shipping. The results are shown below in the following table. A customer is chosen at random. Given that the customer uses the company two to five times per month, what is the probability that they expressed low satisfaction with the company?
QUESTION 41:
Solve the problem.
If x is a binomial random variable, calculate σ for n = 100 and p = 0.3. Round to three decimal places when necessary.
a) 30
b) 5.477
c) 21
d) 4.583
QUESTION 42
Solve the problem.
We believe that 81% of the population of all Business Statistics students consider statistics to be an exciting subject. Suppose we randomly and independently selected 39 students from the population. How many of the sampled students do we expect to consider statistics to be an exciting subject?
a) 39
b) 31.59
c) 33.82
d) 32.16
QUESTION 43
Provide an appropriate response.
According to insurance records, a car with a certain protection system will be recovered 85% of the time. If 100 stolen cars are randomly selected, what is the mean and standard deviation of the number of cars recovered after being stolen?
a) mean: 85; standard deviation: 3.57071421
b) mean: -15: standard deviation: 3.57071421
c) mean: -15: standard deviation: 12.75
d) mean: 85; standard deviation: 12.75
QUESTION 44
Find the mean, μ, for the binomial distribution which has the stated values of n and p. Round answer to the nearest tenth.
a) n = 44; p = 0.2
b) μ = 9.1
c) μ = 8.3
d) μ = 8.8
e) μ = 9.5
QUESTION 45
Solve the problem.
According to a published study, 1 in every 4 men has been involved in a minor traffic accident. Suppose we have randomly and independently sampled twenty-five men and asked each whether he has been involved in a minor traffic accident. How many of the 25 men do we expect to have never been involved in a minor traffic accident? Round to the nearest whole number.
a) 19
b) 4
c) 6
d) 25
QUESTION 46
Provide an appropriate response.
The probability that a house in an urban area will develop a leak is 5%. If 20 houses are
randomly selected, what is the mean of the number of houses that developed leaks?
a) 0.5
b) 1.5
c) 1
d) 2
QUESTION 47
Provide an appropriate response.
The sample space for tossing three fair coins is {HHH, HHT, HTH, HTT, THH, THT, TTH, TTT}. What is the probability of exactly two heads?
3/8
1/2
5/8
3
QUESTION 48:
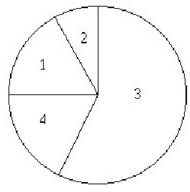
Provide an appropriate response.
Use the spinner below to answer the question. Assume that it is equally probable that the pointer will land on any one of the five numbered spaces. If the pointer lands on a borderline, spin again.
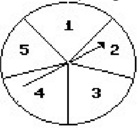
Find the probability that the arrow will land on an odd number.
3/5
1
2/5
0
QUESTION 49:
From the information provided, create the sample space of possible outcomes.
Both Fred and Ed have a bag of candy containing a lemon drop, a cherry drop, and a lollipop. Each takes out a piece and eats it. What are the possible pairs of candies eaten?
a) CD-LD LD-LP LP-CD LP-LP LD-LD
b) LD-LD CD-LD LP-LP LD-CD CD-CD LD-LP LP-CD
c) LD-LD CD-LD LP-LP LD-LP CD-CD LD-LP LP-CD
d) LD-CD LD-CD LD-CD LD-LP LD-LP LD-LP CD-LP
QUESTION 50:
Provide an appropriate response.
You are dealt one card from a standard 52-card deck. Find the probability of being dealt a picture card.
3/13
3/52
1/13
3/26
Assignment 3:
QUESTION 1:
Provide an appropriate response.
Construct a 98% confidence interval for the population mean, μ. Assume the population has a normal distribution. A study of 14 car owners showed that their average repair bill was $192 with a standard deviation of $8. Round to the nearest cent.
a) ($186.33, $197.67)
b) ($222.33, $256.10)
c) ($115.40, $158.80)
d) ($328.33, $386.99)
QUESTION 2
Use the given degree of confidence and sample data to construct a confidence interval for the population mean μ. Assume that the population has a normal distribution.
n = 12, = 28.3, s = 4.8, 99% confidence
a) 24.53 < μ < 32.07
b) 24.00 < μ < 32.60
c) 24.01 < μ < 32.59
d) 23.91 < μ < 32.69
QUESTION 3
Use the confidence level and sample data to find a confidence interval for estimating the population μ. Round your answer to the same number of decimal places as the sample mean.
A random sample of 130 full-grown lobsters had a mean weight of 21 ounces and a standard deviation of 3.0 ounces. Construct a 98% confidence interval for the population mean μ.
a) 21 oz < μ < 23 oz
b) 20 oz < μ < 22 oz
c) 20 oz < μ < 23 oz
d) 19 oz < μ < 21 oz
QUESTION 4
Use the given degree of confidence and sample data to construct a confidence interval for the population mean μ. Assume that the population has a normal distribution.
n = 10, = 8.7, s = 3.3, 95% confidence
a) 6.35 < μ < 11.05
b) 6.79 < μ < 10.61
c) 6.34 < μ < 11.06
d) 6.37 < μ < 11.03
QUESTION 5
Use the given degree of confidence and sample data to construct a confidence interval for the population mean μ. Assume that the population has a normal distribution. Thirty randomly selected students took the calculus final. If the sample mean was 83 and the standard deviation was 13.5, construct a 99% confidence interval for the mean score of all students.
a) 76.23 < μ < 89.77
b) 78.81 < μ < 87.19
c) 76.21 < μ < 89.79
d) 76.93 < μ < 89.07
QUESTION 6
Provide an appropriate response.
Construct a 90% confidence interval for the population mean, μ. Assume the population has a normal distribution. A sample of 15 randomly selected math majors has a grade point average of 2.86 with a standard deviation of 0.78. Round to the nearest hundredth.
a) (2.28, 3.66)
b) (2.51, 3.21)
c) (2.41, 3.42)
d) (2.37, 3.56)
QUESTION 7
Provide an appropriate response.
How much money does the average professional hockey fan spend on food at a single hockey game? That question was posed to 10 randomly selected hockey fans. The sampled results show that sample mean and standard deviation were $16.00 and $3.15, respectively. Use this information to create a 98% confidence interval for the mean. Express the answer in the form x ± tα/2(s/).
16 ± 2.764(3.15/√10)
16 ± 2.821(3.15/√10)
16 ± 2.262(3.15/√10)
16 ± 2.718(3.15/√10)
QUESTION 8
Do one of the following, as appropriate: (a) Find the critical value zα/2, (b) find the critical value tα/2, (c) state that neither the normal nor the t distribution applies.
99%; n = 17; σ is unknown; population appears to be normally distributed.
a) zα/2 = 2.583
b) tα/2 = 2.898
c) zα/2 = 2.567
d) tα/2 = 2.921
QUESTION 9
Do one of the following, as appropriate: (a) Find the critical value zα/2, (b) find the critical value tα/2, (c) state that neither the normal nor the t distribution applies.
91%; n = 45; σ is known; population appears to be very skewed.
a) zα/2 = 1.75
b) tα/2 = 1.34
c) zα/2 = 1.70
d) tα/2 = 1.645
QUESTION 10
Do one of the following, as appropriate: (a) Find the critical value zα/2, (b) find the critical value tα/2, (c) state that neither the normal nor the t distribution applies.
98%; n = 7; σ = 27; population appears to be normally distributed.
a) tα/2 = 2.575
b) zα/2 = 2.05
c) zα/2 = 2.33
d) tα/2 = 1.96
QUESTION 11
Find the t-value.
Find the critical t-value that corresponds to 90% confidence and n = 15.
a) 1.345
b) 1.761
c) 2.624
d) 2.145
QUESTION 12
Provide an appropriate response.
A survey of 100 fatal accidents showed that in 33 cases the driver at fault was inadequately insured. Find a point estimate for p, the population proportion of accidents where the driver at fault was inadequately insured
a) 0.493
b) 0.248
c) 0.67
d) 0.33
QUESTION 13
Solve the problem. Round the point estimate to the nearest thousandth.
22 randomly picked people were asked if they rented or owned their own home, 9 said they rented. Obtain a point estimate of the proportion of home owners.
a) 0.591
b) 0.409
c) 0.290
d) 0.636
QUESTION 14
Solve the problem. Round the point estimate to the nearest thousandth.
50 people are selected randomly from a certain population and it is found that 13 people in the sample are over 6 feet tall. What is the point estimate of the proportion of people in the population who are over 6 feet tall?
a) 0.19
b) 0.50
c) 0.74
d) 0.26
QUESTION 15
Provide an appropriate response.
Many people think that a national lobby's successful fight against gun control legislation is reflecting the will of a minority of Americans. A random sample of 4000 citizens yielded 2290 who are in favor of gun control legislation. Find the point estimate for estimating the proportion of all Americans who are in favor of gun control legislation.
a) 0.5725
b) 2290
c) 4000
d) 0.4275
QUESTION 16
Provide an appropriate response.
A survey of 250 households showed 12 owned at least one snow blower. Find a point estimate for p, the population proportion of households that own at least one snow blower.
a) 0.048
b) 0.050
c) 0.952
d) 0.046
QUESTION 17
Use the given degree of confidence and sample data to construct a confidence interval for the population proportion.
Of 346 items tested, 12 are found to be defective. Construct a 98% confidence interval to estimate the proportion of all such items that are defective.
a) (0.093, 0.600)
b) (0.015, 0.054)
c) (0.014, 0.055)
d) (0.012, 0.058)
e) (0.013, 0.680)
QUESTION 18
Use the given degree of confidence and sample data to construct a confidence interval for the population proportion.
When 293 college students are randomly selected and surveyed, it is found that 114 own a car. Construct a 99% confidence interval for the percentage of all college students who own a car.
a) (34.2%, 43.6%)
b) (31.6%, 44.5%)
c) (32.3%, 45.5%)
d) (33.3%, 44.5%)
e) (31.6%, 46.2%)
QUESTION 19
Use the given degree of confidence and sample data to construct a confidence interval for the population proportion p.
Of 346 items tested, 12 are found to be defective. Construct the 98% confidence interval for the proportion of all such items that are defective.
a) 0.0118 < p < 0.0576
b) 0.0154 < p < 0.0540
c) 0.0345 < p < 0.0349
d) 0.0110 < p < 0.0584
QUESTION 20
Use the given degree of confidence and sample data to construct a confidence interval for the population proportion p.
A survey of 865 voters in one state reveals that 408 favor approval of an issue before the legislature. Construct the 95% confidence interval for the true proportion of all voters in the state who favor approval.
a) 0.435 < p < 0.508
b) 0.438 < p < 0.505
c) 0.471 < p < 0.472
d) 0.444 < p < 0.500
QUESTION 21
Use the given degree of confidence and sample data to construct a confidence interval for the population proportion p.
Of 88 adults selected randomly from one town, 69 have health insurance. Find a 90% confidence interval for the true proportion of all adults in the town who have health insurance.
a) 0.712 < p < 0.856
b) 0.698 < p < 0.870
c) 0.682 < p < 0.886
d) 0.671 < p < 0.897
QUESTION 22
Provide an appropriate response.
A pollster wishes to estimate the number of left-handed scientists. How large a sample is needed in order to be 95% confident that the sample proportion will not differ from the true proportion by more than 3%? A previous study indicates that the proportion of left-handed scientists is 12%.
a) 451
b) 8
c) 513
d) 318
QUESTION 23
Use the given data to find the minimum sample size required to estimate the population proportion.
Margin of error: 0.04; confidence level: 94%; and unknown
a) 587
b) 486
c) 553
d) 572
QUESTION 24
Provide an appropriate response.
Many people think that a national lobby's successful fight against gun control legislation is reflecting the will of a minority of Americans. A previous random sample of 4000 citizens yielded 2250 who are in favor of gun control legislation. How many citizens would need to be sampled if a 95% confidence interval was desired to estimate the true proportion to within 2%?
a) 2498
b) 2209
c) 2364
d) 2401
QUESTION 25
Use the given data to find the minimum sample size required to estimate the population proportion.
Margin of error: 0.05; confidence level: 99%; from a prior study, is estimated by
0.15.
a) 407
b) 196
c) 17
d) 339
QUESTION 26
Provide an appropriate response.
A university dean is interested in determining the proportion of students who receive some sort of financial aid. Rather than examine the records for all students, the dean randomly selects 200 students and finds that 118 of them are receiving financial aid. If the dean wanted to estimate the proportion of all students receiving financial aid to within 2% with 99% reliability, how many students would need to be sampled?
a) 81
b) 4010
c) 1558
d) 970
QUESTION 27
Use the given data to find the minimum sample size required to estimate the population proportion.
Margin of error: 0.024; confidence level: 95%; and unknown
a) 1492
b) 1668
c) 669
d) 1776
QUESTION 28
Solve the problem.
Find the critical value corresponding to a sample size of 3 and a confidence level of
95 percent.
a) 0.103
b) 5.991
c) 0.0506
d) 7.378
QUESTION 29
Use the given degree of confidence and sample data to find a confidence interval for the population standard deviation σ. Assume that the population has a normal distribution.
Round the confidence interval limits to the same number of decimal places as the sample standard deviation.
The mean replacement time for a random sample of 20 washing machines is 9.4 years and the standard deviation is 2.6 years. Construct a 99% confidence interval for the standard deviation, σ, of the replacement times of all washing machines of this type.
a) 1.8 yr < σ < 4.3 yr
b) 1.8 yr < σ < 4.9 yr
c) 1.8 yr < σ < 5.5 yr
d) 1.9 yr < σ < 4.1 yr
QUESTION 30
Use the given degree of confidence and sample data to find a confidence interval for the population standard deviation σ. Assume that the population has a normal distribution.
Round the confidence interval limits to the same number of decimal places as the sample standard deviation.
Weights of men: 90% confidence; n = 14 , = 161.0 lb, s = 10.9 lb
a) 8.8 lb < σ < 2.7 lb
b) 8.1 lb < σ < 15.3 lb
c) 8.6 lb < σ < 14.1 lb
d) 8.3 lb < σ < 16.2 lb