Question 1. Answer each of the following questions by drawing a graph that represents the initial situation and the new situation. Label these graphs completely and carefully. Provide a verbal explanation as well.
a. Consider the market for plain yogurt that is initially in equilibrium. Suppose that a report finds that eating plain yogurt is good for you at the same time that the price of milk, a necessary ingredient in making plain yogurt, increases. What do you predict will happen to the equilibrium price and quantity in the market for plain yogurt? Explain your answer fully and completely and use a graph to illustrate this
answer.
b. Suppose that there are two manufacturers of smartphones initially and that this market is in equilibrium. Then, suppose that three new firms enter this market. What do you predict will happen to the equilibrium price and quantity in the market for smartphones given this information? Explain your answer fully and completely and use a graph to illustrate this answer.
c. Consider the market for bikini swimsuits that is initially in equilibrium. Suppose that tastes and preferences for wearing bikini swimsuits increases while at the same time the number of people planning on buying any bikini swimsuits decreases. Given this information what do you predict will happen to the equilibrium price and quantity in the market for bikini swimsuits? Explain your answer fully and completely and use a graph to illustrate this answer.
d. Consider the market for bicycles in Madison that is initially in equilibrium. Suppose that the price of local bus transportation increases dramatically. Given this information what do you predict will happen to the equilibrium price and quantity in the market for bicycles in Madison? Explain your answer fully and completely and use a graph to illustrate this answer.
e. Consider the market for travel mugs that is initially in equilibrium. Suppose that the technology used to produce these thermal mugs is significantly improved. Given this information what do you predict will happen to the equilibrium price and quantity in the market for travel mugs? Explain your answer fully and completely and use a graph to illustrate this answer.
Question 2. Consider the market for paintbrushes. The market demand and supply curves are given by the following equations where Q is the quantity of paintbrushes and P is the price per paint brush:
Demand: Q = 100 – (1/2)P
Supply: Q = (1/8)P – (20/8
a. Given the above information, find the equilibrium quantity of paintbrushes and the equilibrium price for a paintbrush. Show your work.
b. Given the above information, find the value of consumer surplus (CS), producer surplus (PS), and total surplus (TS). Show your work.
c. Draw a well labeled graph of the market for paintbrushes. In your graph indicate the equilibrium price and the equilibrium quantity. Also, identify the area that corresponds to CS and the area that corresponds to PS.
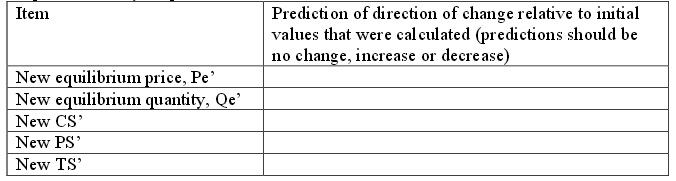
d. Suppose that the market demand curve changes to the following:
New Market Demand: P = 200 - 4Q
Given this new market demand curve and holding everything else constant, fill in the following table with your prediction of what will happen to each of the items listed in the table.
Then provide a verbal explanation for your predictions.
e. Calculate the values of Pe’, Qe’, CS’, PS’, and TS’. Show your work.
Question 3. Suppose there are two consumers in the market for bagels and their individual demand curves are given by the following equations where P is the price per bagel and Q is the quantity of bagels:
Glenn’s demand for bagels: P = 40 – 2Q
Betsy’s demand for bagels: P = 30 – (1/2)Q
a. Draw two different graphs: in the first graph draw Glenn’s demand for bagels and in the second graph draw Betsy’s demand for bagels. Make sure you label all axes and all intercepts clearly.
b. In a third graph draw the market demand curve for bagels. Make sure you label this demand curve carefully and completely; if there is a “kink” point label the coordinates of this point.
c. Based on your graph in (b), write the equation(s) for the market demand curve. Provide a range of price for any demand curve equation you provide. When writing these equations, use the slope-intercept form and also retain fractions rather than decimals if necessary.
Suppose that Paul, a third consumer, enters this market and has the following demand for bagels:
Paul’s demand for bagels: P = 10 - Q
d. Draw a fourth graph that represents the market demand curve for bagels when the market includes Glenn, Betsy, and Paul. Label all intercepts, all axes, and all “kink” points clearly and carefully.
e. Based on your graph in (d), write the equation(s) for the market demand curve. Provide a range of prices for any demand curve equation you provide.
When writing these equations, use the slope-intercept form and also retain fractions rather than decimals when necessary. Check that your answers are correct and that your math is accurate!!
Question 4. Suppose that there are two firms that produce bagels and their individual firm supply curves are given as follows where P is the price per bagel and Q is the quantity of bagels:
Supply curve for Firm A: P = 1 + (2/83)Q
Supply curve for Firm B: P = 1 + (2/83)Q
HINT: In this problem you will find it helpful to retain your fractions as fractions. You will also find it helpful to use a calculator for some of the multiplication and division that is required. Do NOT despair-you can do this set of problems!
a. If there are just these two firms in the market, what is the market supply curve? Show how you found this answer.
b. Given the market demand curve you found in question 3e, and this new information about the firms that produce bagels, calculate the equilibrium price and quantity in the market for bagels.
c. Given your answer in (b), how many bagels will Glenn consume? How many bagels will Betsy consume? How many bagels will Paul consume? Show how you found your answer.
Question 5. Suppose the market for almonds is described by the following market demand and supply curves where P is the price per unit of almonds and Q is the quantity of units of almonds:
Demand: P = 200 – 2Q
Supply: P = 20 + 8Q
a. Suppose a price floor of $90 per unit of almonds is implemented in the almond market. Describe the impact of this price floor on this market.
b. Suppose a price floor of $180 per unit of almonds is implemented in the almond market. Describe the impact of this price floor on this market.
Which side of the market is the “short” side of the market?
c. Given the price floor described in (b), calculate the value of consumer surplus (CS), producer surplus (PS), total surplus (TS), and deadweight loss (DWL). Show your work. Include a graph depicting this market, the price floor and the various areas mentioned.
Question 6. Suppose the market for gasoline in Southmont, a small economy is described by the following two equations where P is measured in dollars per gallon and Q is measured in gallons per month:
Market demand for gasoline: P = 10 – (1/100)Q
Market supply of gasoline: P = (1/150)Q
a. Given this information, determine the equilibrium price and quantity in this market. Show your work.
b. Suppose that the government of Southmont decides that gasoline is too expensive and they decide there should be a price ceiling on gasoline. What must be true about this price ceiling in Southmont if it is to be effective? Explain your answer carefully and with complete sentences.
c. Suppose that the government of Southmont decides that too much gasoline is being consumed in Southmontand they decide to remedy the situation by imposing a price floor that results in 300 gallons of gasoline being consumed each month. Determine the price floor price that the government has imposed given this information. Explain how you got your answer.
Question 7. Suppose that the market for wheat can be described by the following equations where P is the price per bushel and Q is the quantity of bushels:
Market Demand: P = 100 – (1/200)Q
Market Supply: P = 20 + (1/600)Q
a. Suppose that the government implements a price floor program in this market and sets the price floor at $85 per bushel. Describe the effect of this price floor on this market: where possible make numerical calculations of the impact.
Assume that the government purchases any surplus that is produced in this market given this price floor. Will this price floor be effective?
b. Given the price floor described in (a), what is the direct cost to the government of this price floor? Assume that the government is willing to buy up any surplus in the market and store this surplus indefinitely. Show how you calculated this cost to the government.
c. Given the price floor described in (a), what is the amount that consumers expend in buying this good? Show how you calculated this cost to the consumers.
d. Given the information you have been given, draw a graph of this market clearly labeling all intercepts, axis, and intersection points. Also, include the price floor, the area that represents the direct cost to consumers of this price floor, and the area that represents the direct cost to the government of this price floor.
e. Suppose that you are told that the storage costs for the government are equal to $4 per bushel per year.
What is the total annual cost of this program to the government including the cost of storage? Show how you computed your answer.
Question 8. Suppose that you have the same market as in (7), but instead of a price floor the government implements a price guarantee of $50per bushel.
a. Given this price guarantee, how many bushels of wheat will consumers purchase? What will the price per bushel be for the consumer given this price guarantee? Explain how you got your answers.
b. Given this price guarantee, how many bushels of wheat will the government purchase? Explain your answer.
c. What will the cost per bushel to the government of this price guarantee program? Explain your answer.
d. What will be the total cost to the government of this price guarantee program? Explain your answer.