Question 1. Consider a small economy whose market for pencils is described by the following demand and supply equations where P is the price per pencil and Q is the quantity of pencils:
Domestic Demand: P = 20 – (1/20)Q
Domestic Supply: P = (1/80)Q
Suppose this economy opens the pencil market to trade and that the world price is $2 per pencil.
a) Given this information and assuming that this domestic economy opens its pencil market to trade, find the value of imports, value of exports, value of consumer surplus with trade (CStrade), value of producers surplus with trade (PStrade), and the value of total surplus with trade (TStrade). Explain how you found your answers.
Suppose a tariff of $1.00 per pencil is imposed on this good by the domestic economy’s government.
b) Given this tariff, find the values of the following items. Show how you found your answers.
Number of imports with tariff = _________
Number of exports with tariff = _________
Government tariff revenue = __________
CStariff = ________
PStariff = ________
DWL with tariff = _______
c) From the perspective of this domestic economy analyze the impact of this tariff. Who benefits from the tariff and how do they benefit? Who loses from the imposition of the tariff and what is their loss?
Question 2. Consider a small economy whose market for dryers is described by the following demand and supply equations where P is the price per dryer and Q is the quantity of dryers:
Domestic Demand: P = 500 - 10Q
Domestic Supply: P = 100 + 10Q
The world price is $150 for a dryer.
a) Suppose this is initially a closed economy. Find the equilibrium price and equilibrium quantity of dryers in this closed economy.
b) Now, suppose this economy opens its dryer market to trade. What will be the price of a dryer given this decision? Calculate the number of dryers produced by domestic producers, the number of dryers demanded by domestic consumers, the number of imported dryers into this economy, and the number of exported dryers from this economy. Show how you found your answers.
Suppose the government in this small domestic economy imposes an import quota of 20 dryers in this market once it is open to trade.
c) Given this import quota and the provided information, find the values for the following (make sure you explain how you got your answer!). Hint: you might find it helpful to draw a graph to guide your work.
Price with the import quota = _________
Quantity of Dryers demanded domestically with the import quota = _______
Quantity of Dryers supplied domestically with the import quota = _______
DWL due to the imposition of the import quota = ________
License Holder Revenue with the imposition of the import quota = _______
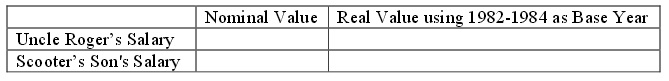
Question 3. It is Thanksgiving and once again Uncle Roger and Scooter have gotten into a heated argument (this happens every year!). Scooter's son just got hired in an entry-level management position where he will earn $32,000 during his first year of employment. Uncle Roger is long retired but he is busy reminiscing about the “good old days” and he insists that life was much tougher for him when he was starting out. In fact he states that his first job paid him only $2000 a year. Uncle Roger got this job in 1950 while Scooter's son got his job in 2014 (the 2015 data weren’t available last Thanksgiving).
a. Scooter argues that Uncle Roger is making a serious error in his argument. Write an explanation about what you think Uncle Roger’s error is. Scooter goes to the computer and finds the Bureau of Labor Statistics site that provides him with the Consumer Price Index for 1950, 2014, and for the base year 1982 - 1984 (this reflects the use of a "chain-weighted index" method)
Year CPI with base year 1982 - 1984
1950 24.1
1982-1984 100.00
2014 236.74
b. Given the above data, what scale is the CPI measured on?
c. Compute the following table’s missing values using 1982 - 1984 as the base year. Make sure you show the work you did to get the missing values. Round your answer to the nearest whole number.
d) Compute the following table’s missing values using 2014 as the base year. Make sure you show the work you did to get the missing values. Round your answer to the nearest whole number.
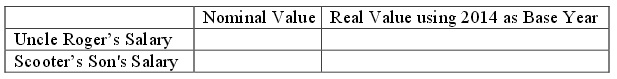
e) Uncle Roger contends that Scooter’s son's salary is 16 times greater than his starting salary was. Thus, Uncle Roger concludes that Scooter's sonhas it much easier than Uncle Roger did when he was first starting out. Analyze this argument and provide some clarity for these two relatives! (If you need to in your answer, round any calculations to two places past the decimal.)
Question 4. Consider the following demand curve for widgets where P is the price per widget and Q is the quantity of widgets.
Demand: Q = 3000 – 3P
a) Fill in the following table using the above information.
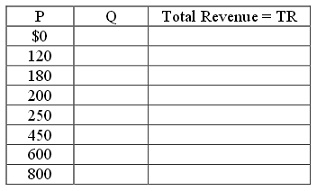
b) In your own words describe what happens to total revenue if the price of this good goes from $450 to $600. In your answer make sure you include references to the price and quantity effects.
c) What is the maximum total revenue that could be earned given this demand curve and holding everything else constant? Assume that the supplier is free to set any price they want and their goal is to set their price to maximize their total revenue.
Note: this price may not be in the table you just filled in!
Question 5. Consider the following market demand and market supply curves for scissors where P is the price per scissor and Q is the quantity of scissors.
Demand: P = 11 – (1/100)Q
Supply: P = 2 + (1/200)Q
a) Given the above information find the equilibrium price and quantity in this market. Show your work.
b) Calculate the point elasticity of demand at equilibrium. Provide the general formula and show your calculations. Is demand elastic or inelastic? Explain your answer. Given this answer, will producers enhance their total revenue by increasing or by decreasing the price they charge for scissors?
c) Calculate the point elasticity of supply at equilibrium. Provide the general formula and show your calculations. Is supply elastic or inelastic? Explain your answer.
d) Suppose the price increases by $1.00. Using the arc elasticity formula calculate the price elasticity of demand between the initial equilibrium and this new point on the demand curve. Provide the general formula and show your work. Is demand inelastic or elastic? Explain your answer.
Question 6.
a. You are told that the income elasticity of demand for bicycles is equal to 4. What does this mean if incomes in an economy increase by 20%?
b. You are told that the cross price elasticity of demand for bicycles and bike helmets is -2. What does this mean if the price of a bike helmet decreases by 10%?
c. You are told that the cross price elasticity of demand for bicycles and bus fares is equal to 1.5 What does this mean if the price of a bus fare increases by 5%?
Question 7. Joe has $100 in income that he can spend on either good X or good Y. Good X costs $1 per unit while good Y costs $2 per unit.
a) Given the above information, draw a graph of Joe’s budget line (call it BL1) and write an equation in slope-intercept form for Joe’s budget line measuring good Y as the good on the vertical axis.
b) Given Joe’s income and the prices of these two goods and given Joe’s preferences he finds that he maximizes his satisfaction when he chooses to consume bundle A which consists of 60 units of good X and 20 units of good Y. Can Joe afford this bundle given his income and the prices of the two goods?
Prove this mathematically. Does consumption of bundle A exhaust Joe’s available income?
c) Suppose that the price of good X increases to $2. Joe’s income and the price of good Y stay constant. Joe now finds that he maximizes his satisfaction when he consumes consumption bundle B which consists of 28 units of good X. Draw a graph that represents Joe’s BL1, his new budget line (BL2), bundle A and bundle B. Calculate how many units of good Y Joe consumes when he consumes consumption bundle B (make sure you show how you found this answer). Mark bundle B in your graph.
d) Suppose that Joe was constrained to stay on his first indifference curve-the one that bundle A sits on-while paying the new price for good X. We can construct this budget line 3 where Joe’s income has been compensated (in this case increased) so that he can reach the indifference curve that bundle A is on. On budget line 3 Joe finds that he maximizes his satisfaction by consuming bundle C which consists of 40 units of good x and 30 units of good Y. Draw a graph that illustrates BL1, BL2, BL3, bundle A, bundle B, and bundle C. Sketch in indifference curve 1 and indifference curve 2 in your graph.
e) How much would Joe’s income have to be increased by in order for him to have the same utility as he had initially while now facing the higher price for good X?
You have all the necessary information at hand to calculate this increase in income. Show how you found your answer.
f) What is the amount of the substitution effect for good X given the above information? What is the amount of the income effect for good X given the above information? Explain your answer.
Question 8. Consider a small, closed economy whose market for pencils is described by the following demand andsupply equations where P is the price per pencil and Q is the quantity of pencils:
Domestic Demand: P = 20 – (1/20)Q
Domestic Supply: P = (1/80)Q
a) Assume this market is a closed market. Find the equilibrium price, equilibrium quantity, the value of consumer surplus (CS), and the value of producer surplus (PS). Show your work. Suppose this economy opens the pencil market to trade and that the world price is $8 per pencil.
b) Verbally explain whether this small economy will import or export pencils given this information.
c) Now, provide a numerical value for your answer in (b). Make sure you show how you found your answer.
d) Suppose this market is still open to trade. Calculate the value of CS in the domestic economy when this market is open to trade (CStrade) and the value of PS in the domestic economy when this market is open to trade (PStrade).
e) Economists state that “trade is beneficial but has distributional consequences”. Explain this statement using your calculations in this problem as proof to support this statement.
Question 9. Consider the market for clocks where the market demand and market supply curves are given by the equations below where P is the price per clock and Q is the quantity of clocks:
Market Demand: P = 250 – 10Q
Market Supply: P = 50 + (10/3)Q
a) Given the above information, find the equilibrium price and quantity in this market. Then calculate the value of consumer surplus (CS) and producer surplus (PS).
b) Draw a graph illustrating this market and in your graph identify the equilibrium price, equilibrium quantity, all intercepts, the area that is CS and the area that is PS.
Suppose that the government in this economy decides to impose an excise tax of $80 per clock on producers of clocks.
c) Given this excise tax, write an equation that represents the supply curve in this market now that producers have this new additional cost.
d) Given this excise tax, find the new price consumers will pay for a clock in this market, the new price producers will receive for a clock in this market once they have met their legal obligation to the government to remit the excise tax, and the new equilibrium quantity of clocks that will be sold in this market.
e) Given this excise tax, calculate the value of consumer surplus with the tax (CSt), producer surplus with the tax (PSt), tax revenue the government receives from implementing the tax, consumer tax incidence (CTI), producer tax incidence (PTI), and the deadweight loss (DWL) due to the implementation of this excise tax.
f) Draw a graph illustrating this market and this excise tax. In your graph identify the price consumers pay for a clock now that the tax has been implemented, the price producers receive once they have paid the government the excise tax, the area of CSt, the area of PSt, the area of CTI, the area of PTI, and the area of DWL.
g) Suppose that the government decides it wants to implement an excise tax in this market so that consumption of clocks falls to 3 units. Calculate the size of the excise tax that would be needed (assume that there is no initial excise tax) for the government to accomplish this goal. Show how you found your answer.
h) As the size of the excise tax increases, what happens to the area of DWL? Provide a verbal explanation and assume that the demand curve is downward sloping and the supply curve is upward sloping.
i) As the size of the excise tax increases, what happens to the level of tax revenue? This is a thought experiment-so provide a verbal explanation rather than a numeric answer. You might think about in this example what the tax revenue is when the excise tax is $0 per clock and what the tax revenue is when the excise tax is $200 per clock. Then, think about what must occur at excise taxes that are set between these two extremes.