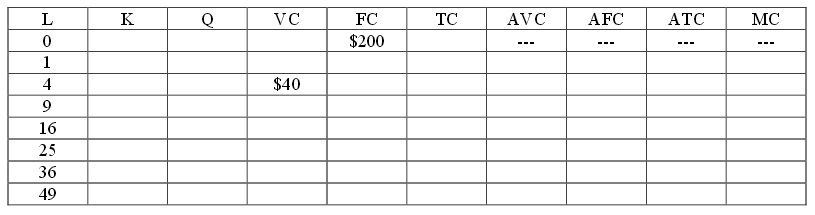
Question 1. Consider an aggregate production function Q= 2K1/2L1/2 where Q is the number of widgets, K is the number of units of capital, and L is the number of units of labor. For this question assume K is initially fixed at 100 units. You also know that total cost, TC, is given as
TC = PkK + PlL
where Pk is the price of capital and Pl is the price of labor. Assume that the price of labor and the price of capital are both constant.
a) Fill in the missing cells of the table below based on the above information. (Hint: you might find it fun to do this with Excel: practice your spreadsheet skills and generate the numbers fast!).
b) What is the price of capital? Explain how you got this answer.
c) What is the price of labor? Explain how you got this answer.
d) Given the above information and your work in (a), fill in the following table. Round your answers to two places past the decimal. (Hint: if you used Excel earlier, you can continue to use Excel in this part of the exercise-just a great way to keep building your spreadsheet skills!)
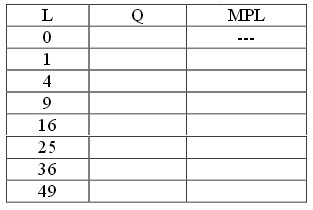
e) Given your work, does the production of this good show diminishing marginal returns to labor? Explain your answer.
f) Suppose that K doubles and L doubles. Without using numeric values, can you prove this production function has constant returns to scale? That is, can you show that if K and L both double that output, Q, will also double?
Question 2. Consider a perfectly competitive industry composed of ten identical firms. Suppose you are told that the representative firm has the following cost curves:
Total Cost: TC = 9 + 6q + q2
Marginal Cost: MC = 6 + 2q
Suppose you also know that the market demand curve is given by the following equation:
Market Demand: P = 20 – (1/2)Q
Q represents market quantity and q represents firm quantity.
a) Given the above information write an equation for the market supply curve. Explain how you found this equation.
b) Given the market supply curve you found in (a), calculate the short run market equilibrium quantity and price in this market. How many units of output will the representative firm produce in the short run? Calculate the short-run profits for the representative firm. Explain your work.
c) Given your calculations in (b), will the representative firm produce in the short-run? Explain your answer.
d) Given your answer in (b), what do you predict will happen in the long-run in this industry?
e) Given no changes in the firm’s cost curves or the market demand curve, calculate the following and explain how you found your answers:
Long-run equilibrium market price = _____
Long-run equilibrium market quantity = _____
Level of production by the representative firm = ______
Approximate number of firms in industry in the long-run (this will not be a whole number) = _____
Question 3. Consider a monopoly. Suppose you are told that the monopoly has the following cost curves:
Total Cost: TC = 9 + 6Q + Q2
Marginal Cost: MC = 6 + 2Q
Suppose you also know that the market demand curve is given by the following equation:
Market Demand: P = 18 – (1/2)
a) Given the above information, what is this monopolist’s equation for MR?
b) Determine the profit maximizing level of production for this monopolist as well as the price that will be charged for each unit of the good. Assume that this is a single price monopolist, i.e. the monopolist cannot engage in price discrimination. Explain how you found your answer.
c) Given the above information and your answer in (b) calculate the level of profit in the short-run for this monopolist. Explain how you found your answer.
d) Given your answer in (c), what do you predict will happen to this monopolist in the long-run?
e) Calculate the deadweight loss that results from this market being served by a monopolist. Show how you found your answer. Provide a graph that is well labeled to illustrate your answer.
7. Joe has $100 in income that he can spend on either good X or good Y. Good X costs $2 per unit while good Y costs $4 per unit.
a) Given the above information, draw a graph of Joe’s budget line (call it BL1) and write an equation in slope-intercept form for Joe’s budget line measuring good Y as the good on the vertical axis.
b) Given Joe’s income and the prices of these two goods and given Joe’s preferences he finds that he maximizes his satisfaction when he chooses to consume bundle A which consists of 30 units of good X and 10 units of good Y. Can Joe afford this bundle given hisincome and the prices of the two goods?
Prove this mathematically. Does consumption of bundle A exhaust Joe’s a vailable income?
c) Suppose that the price of good X decreases to $1. Joe’s income and the price of good Y stay constant. Joe now finds that he maximizes his satisfaction when he consumes consumption bundle B which consists of 56 units of good X. Draw a graph that represents Joe’s BL1, his new budget line (BL2) and bundle A. Calculate how many units of good Y Joe consumes when he consumes consumption bundle B (make sure you show how you found this answer). Mark bundle B in your graph.
d) Suppose that Joe was constrained to stay on his first indifference curve-the one that bundle A sits on-while paying the new price for good X. We can construct this budget line 3 where Joe’s income has been compensated (in this case lowered) so that he can reach the indifference curve that bundle A is on, but he cannot reach a higher level of satisfaction. On budget line 3 Joe finds that he maximizes his satisfaction by consuming bundle C which consists of 36 units of good x and 8 units of good Y. Draw a graph that illustrates BL1, BL2, BL3, bundle A, bundle B, and bundle C. Sketch in indifference curve 1 and indifference curve 2 in your graph.
e) How much would Joe’s income have to be decreased by in order for his to have the same utility as he had initially but now face the lower price of good X? You have all the necessary information at hand to calculate this decrease in income. Show how you found your answer.
f) What is the amount of the substitution effect for good X given the above information? What is the amount of the income effect for good X given the above information? Explain your answer.