Question 1. Answer each of the following questions by drawing a graph that represents the initial situation and the new situation. Label these graphs completely and carefully. Provide a verbal explanation as well.
a. Consider the market for soda pop in New York City. The mayor in NYC has engaged in a campaign to try to discourage people from drinking soda pop due to health concerns about the dangers of obesity and diets high in sugar. At the same time, the price of corn syrup, a major ingredient in soda pop, decreases. Depict the market for soda pop in New York City initially and label the initialequilibrium price, P1; the initial equilibrium quantity, Q1; and the initial supply and demand curves, S1 and D1. Then, illustrate the
effect of the described changes on this market: be careful and thorough in your labeling. Finally provide a verbal statement of your prediction about how these changes will impact the equilibrium price and quantity in this market. Explain your answer verbally.
b. Consider the market for college education in the U.S. and assume that this market is initially in equilibrium at P1 and Q1. Suppose that there is an increase in the number of foreign-born students seeking a college education in the U.S. Illustrate this market’s initial equilibrium as well as its new equilibrium (Q2, P2) in a well labeled graph. Make sure you indicate the direction of any shiftthat occurs in this market.
Explain your answer verbally.
c. Consider the market for leather boots and assume that this market is initially in equilibrium at P1 and Q1. Suppose that there is a decrease in income and that leather boots are a normal good. Illustrate this market’s initial equilibrium as well as its new equilibrium (Q2, P2) in a well labeled graph. Make sure you indicate the direction of any shift that occurs in this market. Explain your answer verbally.
d. Consider the market for smartphones and assume that this market is initially in equilibrium at P1 and Q1. Suppose that there is a decrease in the price of labor used to manufacture the smartphones and, at the same time, there is an increase in the tastes and preferences for smartphones. Illustrate this market’s initial equilibrium as well as its new equilibrium (Q2, P2) in a well labeled graph. Make sure you indicate the direction of any shift that occurs in this market. Explain your answer verbally.
e. Consider the market for noodles and assume that this market is initially in equilibrium at P1 and Q1. Suppose that there is an increase in income and that noodles are an inferior good. At the same time there is a decrease in the number of noodle making firms. Illustrate this market’s initial equilibrium as well as its new equilibrium (Q2, P2) in a well labeled graph. Make sure you indicate the direction of any shift that occurs in this market. Explain your answer verbally.
f. Consider the market for candy and assume that this market is initially in equilibrium at P1 and Q1. Suppose that there is a decrease in the price of sugar which is a major input in the production of candy. At the same time, there is a decrease in thenumber of firms producing candy. Illustrate this market’s initial equilibrium as well as its new equilibrium (Q2, P2) in a well labeled graph. Make sure you indicate the direction of any shift that occurs in this market. Explain your answer verbally.
Question 2. Consider the market for paintbrushes. The market demand and supply curves are given by the following equations where Q is the quantity of paintbrushes and P is the price per paintbrush:
Demand: Q = 50 – (1/2)P
Supply: Q = (1/8)P – (20/8)
a. Given the above information, find the equilibrium quantity of paintbrushes and the equilibrium price for a paintbrush. Show your work.
b. Given the above information, find the value of consumer surplus (CS), producer surplus (PS), and total surplus (TS). Show your work.
c. Draw a well labeled graph of the market for paintbrushes. In your graph indicate the equilibrium price and the equilibrium quantity. Also, identify the area that corresponds to CS and the area that corresponds to PS.
d. Suppose that the market demand curve changes to the following:
New Market Demand: P = 100 - 8Q
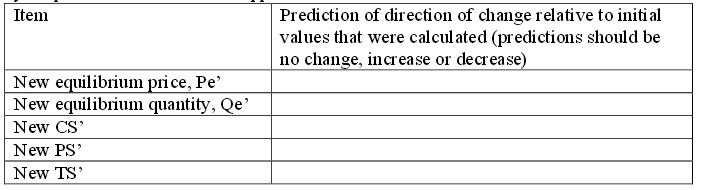
Given this new market demand curve and holding everything else constant, fill in the following table with your prediction of what will happen to each of the items listed in the table.
e. Calculate the values of Pe’, Qe’, CS’, PS’, and TS’. Show your work.
Question 3. Suppose there are two consumers in the market for doughnuts and their individual demand curves are given by the following equations where P is the price per doughnut and Q is the quantity of doughnuts:
Gwen’s demand for doughnuts: P = 20 – 4Q
Howie’s demand for doughnuts: P = 10 – Q
a. Draw two different graphs: in the first graph draw Gwen’s demand for doughnuts and in the second graph draw Howie’s demand for doughnuts. Make sure you label all axes and all intercepts clearly.
b. In a third graph draw the market demand curve for doughnuts. Make sure you label this demand curve carefully and completely; if there is a “kink” point label the coordinates of this point.
c. Based on your graph in (b), write the equation(s) for the market demand curve. Provide a range of price
for any demand curve equation you provide.
Suppose th
at Barbara, a third consumer, enters this market and has the following demand for doughnuts:
Barbara’s demand for doughnuts: P = 5 – (1/2)Q
d. Draw a fourth graph that represents the market demand curve for doughnuts when the market includes Gwen, Howie, and Barbar a. Label all intercepts, all axes, and all “kink” points clearly and carefully.
e. Based on your graph in (d), write the equation(s) for the market demand curve. Provide a range of prices for any demand curve equation you provide.
Question 4. Suppose that there are two firms that produce doughnuts and their individual firm supply curves are given as follows where P is the price per doughnut and Q is the quantity of doughnuts:
Supply curve for Firm A: P = 4 + 1.6Q
Supply curve for Firm B: P = 4 + 1.6Q
a. If there are just these two firms in the market, what is the market supply curve? Show how you found this answer.
b. Given the market demand curve you found in question 3e, and this new information about the firms that produce doughnuts, calculate the equilibrium price and quantity in the market for doughnuts.
c. Given your answer in (b), how many doughnuts will Gwen consume? How many doughnuts will Howie consume? How many doughnuts will Barbara consume? Show how you found your answer.
Question 5. Suppose the market for peanuts is described by the following market demand and supply curves where P is the price per unit of peanuts and Q is the quantity of units of peanuts:
Demand: P = 100 – 2Q
Supply: P = 20 + 8Q
a. Suppose a price floor of $70 is implemented in the peanut market. Describe the impact of this price floor on this market.
b. Suppose a price floor of $92 is implemented in the peanut market. Describe the impact of this price floor on this market. Which side of the market is the “short” side of the market?
c. Given the price floor described in (b), calculate the value of consumer surplus (CS), producer surplus (PS), total surplus (TS), and deadweight loss (DWL). Show your work. Include a graph depicting this market, the price floor and the various areas mentioned.
Question 6. Suppose the market for gasoline in Xerbia, a small economy is described by the following two equations where P is measured in dollars per gallon and Q is measured in gallons per month:
Market demand for gasoline: P = 5 – (1/2000)Q
Market supply of gasoline: P = (1/3000)Q
a. Given this information, determine the equilibrium price and quantity in this market. Show your work.
b. Suppose that the government of Xerbia decides that gasoline is too expensive and they decide there should be a price ceiling on gasoline. What must be true about this price ceiling in Xerbia if it is to be effective? Explain your answer carefully and with complete sentences.
c. Suppose that the government of Xerbia decides that too much gasoline is being consumed in Xerbia and they decide to remedy the situation by imposing a price floor that results in 3000 gallons of gasoline being consumed each month. Determine the price floor price that the government has imposed given this information. Explain how you got your answer.
Question 7. Suppose that the market for corn can be described by the following equations where P is the price per bushel and Q is the quantity of bushels:
Market Demand: P = 25 – (1/200)Q
Market Supply: P = 5 + (1/600)Q
a. Suppose that the government implements a price floor program in this market and sets the price floor at $18 per bushel. Describe the effect of this price floor on this market: where possible make numerical calculations of the impact. Will this price floor be effective?
b. Given the price floor described in (a), what is the direct cost to the government of this price floor?
Assume that the government is willing to buy up any surplus in the market and store this surplus indefinitely. Show how you calculated this cost to the government.
c. Given the price floor described in (a), what is the amount that consumers expend in buying this good?
Show how you calculated this cost to the consumers.
d. Given the information you have been given, draw a graph of this market clearly labeling all intercepts, axis, and intersection points. Also, include the price floor, the area that represents the direct cost to consumers of this price floor, and the area that represents the direct cost to the government of this price floor.
e. Suppose that you are told that the storage costs for the government are equal to $8 per bushel per year. What is the total annual cost of this program to the government including the cost of storage? Show how you computed your answer.
Question 8. Suppose that you have the same market as in (7), but instead of a price floor the government implements a price guarantee of $12 per bushel.
a. Given this price guarantee, how many bushels of corn will consumers purchase? What will the price per bushel be for the consumer given this price guarantee? Explain how you got your answers.
b. Given this price guarantee, how many bushels of corn will the government purchase? Explain your answer.
d. What will be the total cost to the government of this price guarantee program? Explain your answer.