Exercise 1:
Let
A = 250/I+100
�and
T = 1/ 5I�
For the expressions for an and bn, use MATLAB to plot the function
for values of N = 5, 10, 20, for the time interval 0 ≤ t ≤ T. Plot the original periodic square wave on the same graph. Comment on the difference between the original periodic square wave and its truncated Fourier series presentation.
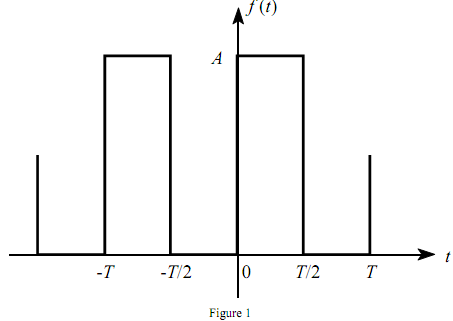
Exercise 2:
Use MATLAB to plot the periodic square wave 5 f(t) over the time interval 0 ≤ t ≤ 3T . On the same graph, plot the output waveforms, f0(t), of the two amplifiers with corner frequencies of F = 10I and F = 40I, respectively. Comment on the plots.
Exercise 3:
Matrix A and vector b are defined by
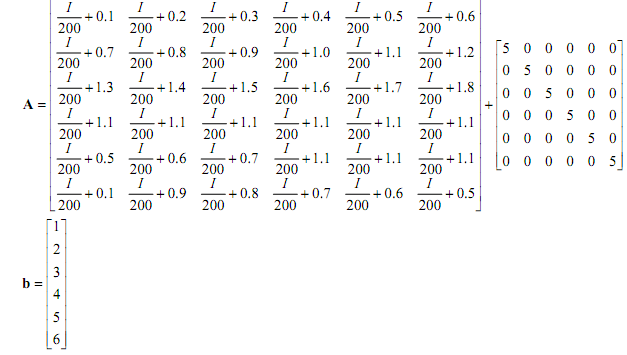
(a) Solve the linear system of equations Ax = b using MATLAB.
(b) Find A-1 �and verify that A-1 A = I, where I is the 6X6 identity matrix. Compute x = A-1b using MATLAB and check the result with that of (a).
(c) Compute the determinant of A.
(d) Take matrix A' as A' = A + A�T, where AT is the transpose of A . Using MATLAB, solve the linear system of equations A'x = b.
(e) Take matrix S as
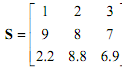
Compute the rank of S manually and use the MATLAB function to verify the result.