Let
A = 250/I+100
�and
T = 1/ 5I�
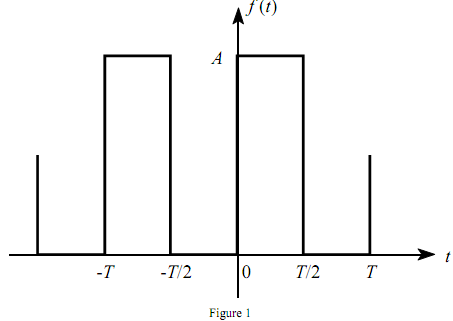
For the expressions for an and bn, use MATLAB to plot the function
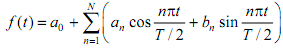
for values of N = 5, 10, 20, for the time interval 0 ≤ t ≤ T. Plot the original periodic square wave on the same graph. Comment on the difference between the original periodic square wave and its truncated Fourier series presentation.