Question 1. Suppose that annual demand for a year's undergraduate education at the University of Wisconsin is given by the equation Qd =10 - 2P while the supply curve is given by QS = P - 2 .
a. At what price would the quantity demand be 0? At what price would the quantity supplied be 0?
b. Draw the supply and demand curves and label the equilibrium price and quantity.
c. Calculate the equilibrium price and quantity algebraically..
d. Calculate the consumer surplus and producer surplus and show the areas corresponding to the consumer surplus and producer surplus.
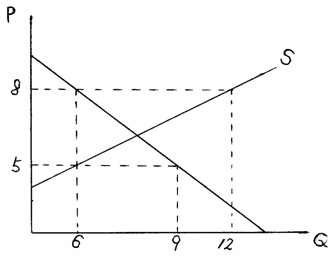
Question 2. Barney the dinosaur has become a fixture in the homes of many families with young children (much to the chagrin of many parents!). Consider the market for Barney lunchboxes. Suppose that the demand for Barney boxes is given by Qd = 100 - 2P and the supply curve is given by QS = - 20 + 10P . All quantities arc in millions.
a. Graph the supply and demand curves for Barney lunchboxes. Clearly mark on the graph the equilibrium price and quantity.
b. The equilibrium price is and the equilibrium quantity is .
c. Suppose that Jurassic Park lunchboxes increase in price (pretend that they are substitutes). What will happen to the demand for Barney boxes? The price of Barney boxes will and the quantity of Barney boxes will .
d. Suppose instead that a technological advance in lunchbox-making makes lunchbox production less costly. The price of Barney boxes will and the quantity of Barney boxes will .
c. Now, suppose that the Surgeon General releases a study suggesting that over exposure to Barney may result in mental paralysis, and parents believe this. The price of Barney boxes will and the quantity of Barney boxes will .
f. Suppose instead that President Clinton. at a press release, announces that "I've seen the plight of the middle class. For too long, they've been forced to pay back-breaking high prices for consumer products with purple and green dinosaurs on them." As a result, Clinton mandates that the maximum price of a Barney lunchbox will be S4. The quantity demanded is and the quantity supplied is . How many Barney boxes will be sold? There will be of Barney lunchboxes equal to .
Question 3. Consider the following broccoli market supply and demand curves:
a. Find the equations for the supply and demand curves.
b. What is the equilibrium price in this market? At this equilibrium price, what is the quantity demanded and the quantity supplied?
c. Suppose the government passes a minimum price of $5. If this policy is enacted, what happens to the quantity of broccoli demanded compared to the market allocation? Will there be surplus or shortage if this policy is enacted? If so, what is this surplus or shortage?
d. Suppose, instead, that the government passes a minimum price of $8. If this policy is enacted, what happens to the quantity demanded compared to the market allocation? Will there be a surplus or shortage as a result of the policy? If so, what is this surplus or shortage?
e. Now, suppose the government passes a maximum price of $5. If this policy is enacted, what happens to the quantity of broccoli demanded compared to the market allocation? Will there be surplus or shortage if this policy is enacted? If so, what is this surplus or shortage?
f. Suppose, instead, that the government passes a maximum price of $8. If this policy is enacted, what happens to the quantity demanded compared to the market allocation? Will there be a surplus or shortage as a result of the policy? If so, what is this surplus or shortage?
The problems from #4 to #6 will be discussed after the first midterm exam.
Problem 4. Suppose that the market for apartments is such that the equilibrium price for apartments (i.e. the rent) is $600. Special interest groups lobby the local government and convince the authorities to initiate a rent control of $500. The rent control is a price ceiling, i.e. the price cannot go higher than $500 (vs. the minimum price which is a price floor: the price can't go lower than some amount).
a. Suppose that the supply curve for apartments is very inelastic. Under this case, graphically show the impact of the government's policy. In particular, show the shortage of housing that results from such a policy.
b. Suppose, instead, that the supply curve for apartments is "very" elastic. Let the demand curve have the identical shape as the one you drew in part a. Under this case, graphically show the impact of the government's policy. In particular, show the shortage of housing that results from such a policy.
c. How does the resulting shortage found in part a. compare to the resulting shortage found in part b.? Does this result make sense? Explain.
Problem 5. Suppose the supply curve for gasoline is given by P = .2Qs, and the demand curve is given by P = -.6Qd +8 where quantity is measured in gallons per day and price is per gallon.
a. Identify the equilibrium price and quantity in the market for gasoline. Graph your results.
b. A tax of $2 per gallon is imposed on gasoline. The tax is paid to the government by the sellers. Show the change in the supply and demand schedules as a result of the tax. Identify on a graph the new equilibrium quantity, the total price paid by consumers, and the net price received by firms.
c. What are total tax collections? Give a dollar figure and show graphically what these collections are. What are the incidences of the tax on producers and consumers, respectively? What is the deadweight loss resulting from this tax? Show the areas corresponding to taxes paid by consumers, taxes paid by sellers and deadweight loss.
d. If the government wants to reduce gasoline consumption to 2 gallons per day, how large a tax should they impose?
e. If the demand curve were very inelastic (but went through the equilibrium point you found in part a), would consumers pay a higher or lower share of the total taxes collected? Illustrate with a new diagram.
f. If the supply curve were very inelastic (but went through the equilibrium point you found in part a) and the demand curve were unchanged, would consumers pay a higher or lower share of the total taxes collected? Illustrate with a new diagram.
Problem 6. The demand curve for pizzas is given by Qd = 200 — 4P .
a. Calculate the price elasticity of demand (rounded to two decimal places).
i) between $5 and $10
ii) between $10 and $20
iii) between $20 and $30
iv) between $30 and $40
b. What is the slope of the demand curve?
c. Is the price elasticity of demand increasing, decreasing, or constant along the demand curve as quantity increases? Why?