Problem 1. Tariff Question
The domestic demand and supply functions for cars in the small closed economy of Vanland are:
QD = 18 - P
QS = 2P
Suppose that Vanland decides to open trade with other countries at a world price equal to $4.
i) Find the change in consumer surplus, producer surplus and total surplus when Vanland decides to open their economy to trade.
ii) What is the quantity of cars imported by Vanland?
Now, suppose that Vanland decides to impose a tariff on imported cars. This tariff results in the price of cars rising by $1.
iii) Find the new consumer surplus and producer surplus values after the imposition of this tariff.
iv) What is the level of imports with the new tariff? What does tariff revenue equal?
v) Calculate the dead weight loss from the tariff program
vi) Suppose Vanland decides to use a quota program instead of a tariff to limit the level of imports. What would the import quota need to be in order for the price of cars and the quantity of cars to be the same with a quota program or the tariff? Draw the graph indicating the effect of this import quota.
Problem 2. Misuzu can choose between working at home or working outside her home. Suppose Misuzu has two choices of goods she can choose to consume: one good we will call the home product and the other good we will call the market product. If Misuzu works at home, she can buy the home product for $.33 per unit and the market product for $1 per unit while earning an income of $5. If Misuzu works outside her home, she can buy both the home and market products at a price of $1 per unit and she will earn an income of $10.
i) Draw the budget line when Misuzu works at home (BL1) and the budget line when Misuzu works outside her home (BL2). In your graph place the home product (H) on the y-axis and the market product (M) on the horizontal axis.
ii) Draw an indifference curve that depicts a utility maximization point for Misuzu given that she prefers to work outside her home rather than work at home.
iii) Draw an indifference curve that depicts a utility maximization point for Misuzu given that she prefers to work at home rather than work outside the home.
iv) Draw an indifference curve that depicts a situation in which Misuzu is indifferent between working outside her home and working at her home.
Problem 3. Consider the following budget line. What causes the budget line to move from A to B?
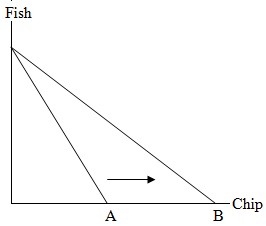
a. The price of fish decreases
b. The price of chips decreases
c. The price of chips increases
d. Income increases
e. The prices of both fish and chips decrease
Problem 4. Consider the following indifference curve. What causes the IC to move from A to B?
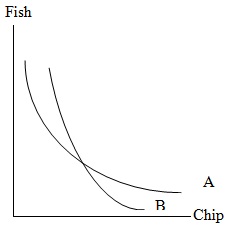
a. The consumer prefers fish to chips
b. The consumer prefers chips to fish
c. The consumer’s income increases
d. The price of chips decreases
e. The price of fish decreases
Problem 5. The price of fish in 1994 is $9 per pound. The price of fish in 2004 is $12 per pound. The CPI index in 2004 with 1994 as the base year is 1.2. The price of fish in real terms
a. Increases by $3/pound
b. Increases by $1.2/pound
c. Decreases by $1.2/pound
d. Decreases by $1/pound
e. Increases by $1/pound
Problem 6. Suppose that people live in a two-period world. The first period is called “young” and the second period is called “old”. People can work only when they are young but they have to consume in both periods. Therefore, their consumption choices are to choose between consuming when they are young (today) or saving when they are young and consuming when they are old. Assume the consumer starts with an initial budget line BL1. Draw the change in the budget line (call the new budget line BL2) for the consumer in the following situations.
i) Total income increases for the consumer
ii) The interest rate increases over the person’s time to work while young
(hint: draw a budget line on a diagram that has consumption when old on the Y-axis and consumption when young on the X-axis).
Problem 7. Draw an indifference curve for the following two pairs of goods:
i) Pepsi and Coca-cola (assume that they are perfect substitutes)
ii) Left shoes and right shoes (assume the individual has both a left and a right foot)
Problem 8. Ning has income of $1000. She spends this money on food and sports. Suppose the price of food is $50 and the price of sports is $100.
i) Draw Ning’s budget line (BL1) placing sports on the vertical axis and food on the horizontal axis.
ii) Select a point A that represents Ning’s utility maximization point given her tastes and her income and the prices of the two goods. On the graph label the amount of food and sports that Ning chooses to consume.
iii) Then, suppose that Ning’s income increases to $1500 and the price of sports increases to $150. Draw Ning’s new budget line and label it BL2 in the diagram.
iv) Select a point B that represents Ning’s utility maximization point given her tastes and her income and the prices of the two goods. On the graph label the amount of food and sports that Ning now chooses to consume.
v) Will Ning still be able to consume at point A? Will Ning continue to choose point A with the new budget line BL2?
Problem 9. Consider the following indifference curves. Which of the following statements is true?
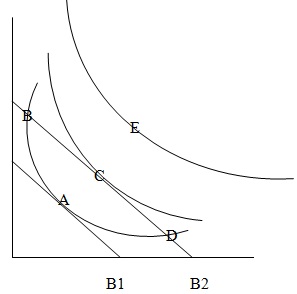
a. The consumer prefers point B to point A
b. The consumer is indifferent between point B and point C
c. Point D is the best affordable choice when the consumer’s budget line is B2
d. Point C is the best affordable choice when the consumer’s budget line is B2
e. The consumer prefers point C to point E.
Problem 10. A fork and a knife are two goods that are used together. Suppose that Ben has income of $40 per month and that the price of a fork is $2 per unit and the price of a knife is $3 per unit.
a.) Draw the budget line and an indifference curve indicating a point that could represent Ben’s utility maximization point for forks and knives.
b.) Find the best affordable consumption bundle (Hint: Remember that forks and knives are used together).
Use the following information to answer the following two questions:
Daniel has an income of $40 per month. In each month, Daniel consumes either books or food. The price of food is $4 per unit and the price of books is $10 per book. Suppose that both goods are normal goods and the price of food changes to $2.
Problem 11. What is the substitution effect in this situation?
a. Daniel consumes more food and fewer books
b. Daniel consumes more food and books
c. Daniel consumes less food and more books
d. Daniel consumes less food and books
e. The information is insufficient to answer this question.
Problem 12. What is the income effect in this situation?
a. Daniel consumes more food and fewer books
b. Daniel consumes more food and books
c. Daniel consumes less food and more books
d. Daniel consumes less food and books
e. The information is insufficient to answer this question.