--%>

Linde liquefaction process

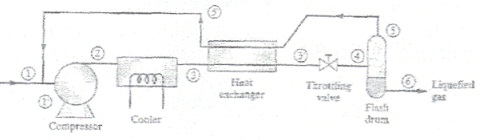
Liquefied natural gas (LNG) is produced using a Linde liquefaction process from pure methane gas at 3 bar and 280 K (conditions at point 1 in figure below). A three-stage compressor with interceding is used to compress the methane to 100 bar (point 2). The first stage compresses the gas from 1 bar to 5 bar, the second stage from 5 bar to 25 bar, and the tiiird stage from 25 bar to 100 bar. Between stages the gas Is isobarically cooled to 280 K. Each stage of the compressor can be assumed to operate reversibly and adiabaticaliy. The methane leaving the cooler is at 100 bar and 210 K (point 3). The flash dram is adiabatic and operates at! bar. The recycled methane leaving the heat exchanger (point 5') is at I bar and 200 K.

a) Calculate the fractions of vapour and liquid leaving the flash drum {Hint: write balance equations around the subsystem consisting of the heat exchanger, throttle valve and flash drum).

b) Calculate the temperature at the inlet of the compressor (point I).

c) Calculate the amount of work required for each kilogram of methane that passes through the compressor.

d) Calculate the amount of compressor work required for each kilogram of LNG produced.

e) Calculate

i) the heat removal after the first and second stages of the compressor,
ii) the heat removed in the cooler, and
iii) the heat exchanged in the heat exchanger.

Express all values in kJ/kg of methane that passes through the compressor.

Data: The thermodynamic properties of methane are given in the attached diagram.
71_diagram.jpg

   Related Questions in Chemistry

  • Q : Procedure to judge that organic

    Describe briefly the procedure to judge that the given organic compound is pure or not?

  • Q : What is covalent radii? Explain its

    Average covalent radii can be assigned on the basis of molecular structures. The accumulation of structural data by spectroscopic studies and both electron and x-ray diffraction studies allows one to investigate the possibili

  • Q : Molar mass of compound The freezing

    The freezing point of a solution having 4.8 g of a compound in 60 g of benzene is 4.48. Determine the molar mass of the compound (Kf = 5.1 Km-1) , (freezing point of  benzene = 5.5oC)          &n

  • Q : Molarity in Nacl The molarity of 0.006

    The molarity of 0.006 mole of NaCl in 100 solutions will be: (i) 0.6 (ii) 0.06 (iii) 0.006 (iv) 0.066 (v) None of theseChoose the right answer from above.Answer: The right answer is (ii) M = n/ v(

  • Q : Question associated to vapour pressure

    Choose the right answer from following. The vapour pressure lowering caused by the addition of 100 g of sucrose(molecular mass = 342) to 1000 g of water if the vapour pressure of pure water at 25degree C is 23.8 mm Hg: (a)1.25 mm Hg (b) 0.125 mm Hg (c) 1.15 mm H

  • Q : What are Vander Waal's Radii? Vander

    Vander Waal's radii can be assigned to the atoms of molecules on the basis of the closeness of approach of these atoms in crystalline substances. Diffraction studies of crystals give information about hoe molecules can approach each other and can pack

  • Q : Molecular energies and speeds The

    The average translational kinetic energies and speeds of the molecules of a gas can be calculated.The result that the kinetic energy of 1 mol of the molecules of a gas is equal to 3/2 RT can be used to obtain numerical values for the

  • Q : Describe Thermodynamics Properties The

    The free energy property leads to convenient expressions for the volume and pressure dependence of internal energy, enthalpy and the heat capacities.All the properties of a chemical system, a sample of a substance, or a mixture of substances have some fixe

  • Q : Molar concentration Choose the right

    Choose the right answer from following. Molar concentration (M) of any solution : a) No. of moles of solute/Volume of solution in litre (b) No. of gram equivalent of solute / volume of solution in litre (c) No. of moles os solute/ Mass of solvent in kg  (

  • Q : Pressure Phase Diagrams The occurrence

    The occurrence of different phases of a one component system can be shown on a pressure temperature. The phases present in a one line system at various temperatures can be conveniently presented on a P- versus-T diagram. An example is pro