Assignments: Risk & Quality Management
Assignment 3: George's Thanksgiving Trip
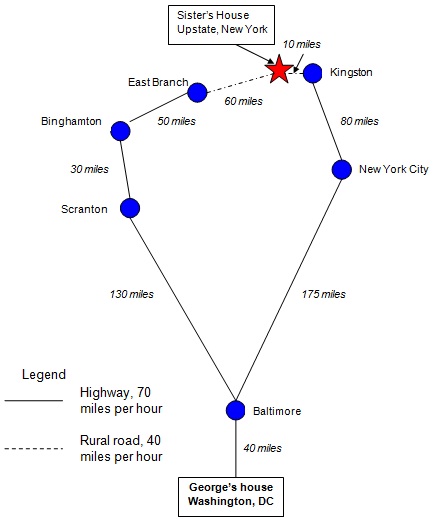
George is invited by his sister, Dorothy, to attend a family reunion during the Thanksgiving weekend. Dorothy lives in Denver, NY, about 90 miles northeast of New York City. George lives in Washington, DC, about 215 miles south of New York City. George decides to visit Dorothy and to travel to her place by car.
The only problem is that road traffic during the Thanksgiving holidays is terrible along the East Coast of the United States. George would normally travel to Dorothy's house by taking Interstate Highway 95. This is the major link connecting Washington and New York City. However, during Thanksgiving, the traffic on I-95 is usually bad, leading to major delays.
George decides to explore an alternate route to traveling to Dorothy's. This route would be a few miles longer. Also, he would encounter a 60 mile segment of road in a rural area, and he would have to travel slowly on this segment. The good feature about the alternate route is that it is unlikely to suffer from Thanksgiving traffic.
A map showing the two routes to Dorothy's house is offered in Figure 1.
Based on his experience in traveling along I-95 during Thanksgiving holidays, George has developed a good sense of the likelihood of delays that he can encounter on the journey. Table 1 shows the probability distributions he has created for all the segments of his trip to Dorothy for both the I-95 route and the alternate route.
Task
Using the information supplied in Figure 1 and Table 1, determine the expected amount of time it will take George to travel from Washington, DC to his sister's house, employing both the I-95 and alternate route. SHOW YOUR WORK, DEMONSRATING HOW YOU ARRIVED AT THE ANSWERS YOU PROVIDE.
Figure 1. Two Routes to George's Sister's House
Probability Distributions for Travel Times on Journey
|
Regular Route (East Route)
|
Probability achieving schedule
|
Probability 10% longer than schedule
|
Probability 20% longer than schedule
|
Probability 30% longer than schedule
|
Probability 40% longer than schedule
|
|
Segment
|
|
|
|
|
|
|
Washington-Baltimore
|
0.7
|
0.3
|
0.0
|
0.0
|
0.0
|
|
Baltimore-New York City
|
0.0
|
0.1
|
0.2
|
0.5
|
0.2
|
|
New York City-Kingston
|
0.1
|
0.2
|
0.3
|
0.3
|
0.1
|
|
Kingston-Sister's Home
|
0.8
|
0.2
|
0.0
|
0.0
|
0.0
|
|
|
|
|
|
|
|
|
Alternate Route (West Route)
|
Probability of achieving schedule
|
Probability 10% longer than schedule
|
Probability 20% longer than schedule
|
Probability 30% longer than schedule
|
Probability 40% longer than schedule
|
|
Segment
|
|
|
|
|
|
|
Washington-Baltimore
|
0.7
|
0.3
|
0.0
|
0.0
|
0.0
|
|
Baltimore-Binghamton
|
0.9
|
0.1
|
0.0
|
0.0
|
0.0
|
|
Binghamton-E Branch
|
0.9
|
0.1
|
0.0
|
0.0
|
0.0
|
|
E Branch-Sister's Home
|
0.8
|
0.2
|
0.0
|
0.0
|
0.0
|
Assignment 4: Monte Carlo Simulation Exercise
Equipment Installation at Globus Enterprises
The equipment installation group at Globus Enterprises is about to make a cost estimate to determine how much it will cost to install a back-up generator at a government laboratory facility. Over the years, this group has carried out more than 100 such installations and has developed a database reflecting past experience. Data on the distribution of cost for design work, building effort, and testing effort is provided in Table 1.
|
|
Cheapest
($/%)
|
Usual
($/%)
|
Expensive
($/%)
|
|
Design
|
9,000/30
|
10,000/40
|
12,000/30
|
|
Build
|
60,000/20
|
70,000/60
|
80,000/20
|
|
Test
|
18,000/20
|
20,000/50
|
24,000/30
|
|
Table 1. Historical Data on Cost Distributions
The data in the table picture the cost of an effort and the percentage of times this cost is achieved. For example, 30% of the time, "Design" cost $9,000; 40% of the time it cost $10,000; 30% of the time it cost $12,000.
|
00 16 45 84 18
83 28 82 36 91
95 14 80 68 34
54 55 13 20 70
57 68 61 37 30
09 81 24 55 21
Table 2. Two-digit Random Numbers
Questions
1. Conduct a Monte Carlo simulation to create a distribution portraying total estimated project costs. Employ ten iterations in your computation. Display the distribution graphically.
2. On the average, how much does it cost to carry out this project?
3. What is the standard deviation of the distribution that you generated (use the formula: SD = √Σ(Xi - X-bar)2/N, where SD = standard deviation, √ = square root symbol, Σ = the summation sign, Xi = the ith value of X, X-bar = the mean of the X values, and N = the number of values being considered)? What information does the standard deviation offer us that helps us develop a better understanding of risk in this case? (For more help on computing standard deviation, see below.)
4. Roughly what is the probability that the project will cost more than $105,000?
|
Computing standard deviation for following numbers: 8, 4, 10, 7, 6
|
|
|
|
|
|
|
|
|
|
|
|
|
|
|
|
X
|
X-bar
|
x - X-bar
|
Squared
|
|
|
|
|
|
|
8.00
|
7.00
|
1.00
|
1.00
|
|
|
|
|
|
|
4.00
|
7.00
|
-3.00
|
9.00
|
|
|
|
|
|
|
10.00
|
7.00
|
3.00
|
9.00
|
|
|
|
|
|
|
7.00
|
7.00
|
0.00
|
0.00
|
|
|
|
|
|
|
6.00
|
7.00
|
-1.00
|
1.00
|
|
|
|
|
|
Total =
|
35.00
|
|
|
20.00
|
|
|
|
|
|
Average = X-Bar =
|
7.00
|
|
|
4.00
|
(Sum Squared)/N = Variance
|
|
|
|
|
|
|
2.00
|
Sqrt(Variance) = Standard Deviation
|
|
|
|
|
|
|
|
|
|
|
|
Computing standard deviation for following numbers: 6, 7, 5.5, 8, 8.5
|
|
|
|
|
|
|
|
|
|
|
|
|
|
|
|
X
|
X-bar
|
x - X-bar
|
Squared
|
|
|
|
|
|
|
6.00
|
7.00
|
-1.00
|
1.00
|
|
|
|
|
|
|
7.00
|
7.00
|
0.00
|
0.00
|
|
|
|
|
|
|
5.50
|
7.00
|
-1.50
|
2.25
|
|
|
|
|
|
|
8.00
|
7.00
|
1.00
|
1.00
|
|
|
|
|
|
|
8.50
|
7.00
|
1.50
|
2.25
|
|
|
|
|
|
Total =
|
35.00
|
|
|
6.50
|
|
|
|
|
|
Average = X-Bar =
|
7.00
|
|
|
1.30
|
(Sum Squared)/N = Variance
|
|
|
|
|
|
|
1.14
|
Sqrt(Variance) = Standard Deviation
|
|
|
|
|
|
|
|
|
|
|
|
Note that the spread of numbers in the first case above is greater than the second case, so that
|
|
standard deviation in the first case (SD = 2.00) is greater than in the second (SD = 1.14)
|
|
Format your assignment according to the following formatting requirements:
1. The answer should be typed, double spaced, using Times New Roman font (size 12), with one-inch margins on all sides.
2. The response also include a cover page containing the title of the assignment, the student's name, the course title, and the date. The cover page is not included in the required page length.
3. Also Include a reference page. The Citations and references should follow APA format. The reference page is not included in the required page length.