Complete the following:
Q1: The figure below graphs the density curve for a uniform distribution. Use areas under this density curve to response the following questions.
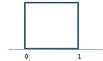
a). Why is the total area under this curve equal to 1?
The total area under this curve is equal to 1 because a density curve has area of exactly 1 underneath it. Area equals 1 because the square represents all numbers between 0 and 1 and the area of a square with base 1 and height 1 = area under curve is 1.
b). What proportion of the observations lie below .35?
c). What proportion of the observations lie between .35 and .65?
Q2. Too much cholesterol in the blood increases the risk of heart disease. Young women are generally less afflicted with high cholesterol than other groups. The cholesterol levels for women aged 20 to 34 follow an approximately Normal distribution with mean 185 miligrams per deciliter (mg/dl) and standard deviation 39 mg/dl.
(a). Cholesterol levels above 240 mg/dl demand medical attention. What percent of young women have levels above 240 mg/dl?
(b). Levels above 200 mg/dl are considered borderline high. What percent of young women have blood cholesterol between 200 and 240 mg/dl?