Discussion:
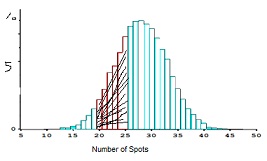
1. The figure below shows the probability histogram for the total number of spots when a die is rolled eight times. The shaded area represents the chance that the total will be between__ _ and ___ (inclusive).
2. A coin is tossed 100 times. True or false, and explain:
(a) The expected value for the number of heads is 50.
(b) The expected value for the number of heads is 50, give or take 5 or so.
(c) The number of heads will be 50.
(d) The number of heads will be around 50, give or take 5 or so.
3. The below data contains measurements made on men involved in a physical fitness course at N.C. State University. The variables are age (years), weight (kg), oxygen intake rate (ml per kg body weight per minute), time to run 1.5 miles (minutes), heart rate while resting, heart rate while running (same time oxygen rate measured), and maximum heart rate recorded while running.
a. For the variables age and weight calculate their means and standard deviations
b. Determine whether these variables are approximately normally distributed.
c. For the variables age and weight calculate a 95% confidence interval for the mean.
d. Define a new variable that classifies individuals as ‘old' or ‘young' according to whether they are below or above 43 years old. Then calculate means, standard error and a 95% confidence interval for the mean time to run 1.5 miles for both the young and the old individuals. Do they seem different to you?
e. Write a brief report of your answers.
| age |
weight |
oxygen |
runtime |
rstpulse |
runpulse |
maxpulse |
| 44 |
89.47 |
44.609 |
11.37 |
62 |
178 |
182 |
| 40 |
75.07 |
45.313 |
10.07 |
62 |
185 |
185 |
| 44 |
85.84 |
54.297 |
8.65 |
45 |
156 |
168 |
| 42 |
68.15 |
59.571 |
8.17 |
40 |
166 |
172 |
| 38 |
89.02 |
49.874 |
9.22 |
55 |
178 |
180 |
| 47 |
77.45 |
44.811 |
11.63 |
58 |
176 |
176 |
| 40 |
75.98 |
45.681 |
11.95 |
70 |
176 |
180 |
| 43 |
81.19 |
49.091 |
10.85 |
64 |
162 |
170 |
| 44 |
81.42 |
39.442 |
13.08 |
63 |
174 |
176 |
| 38 |
81.87 |
60.055 |
8.63 |
48 |
170 |
186 |
| 44 |
73.03 |
50.541 |
10.13 |
45 |
168 |
168 |
| 45 |
87.66 |
37.388 |
14.03 |
56 |
186 |
192 |
| 45 |
66.45 |
44.754 |
11.12 |
51 |
176 |
176 |
| 47 |
79.15 |
47.273 |
10.6 |
47 |
162 |
164 |
| 54 |
83.12 |
51.855 |
10.33 |
50 |
166 |
170 |
| 49 |
81.42 |
49.156 |
8.95 |
44 |
180 |
185 |
| 51 |
69.63 |
40.836 |
10.95 |
57 |
168 |
172 |
| 51 |
77.91 |
46.672 |
10 |
48 |
162 |
168 |
| 48 |
91.63 |
46.774 |
10.25 |
48 |
162 |
164 |
| 49 |
73.37 |
50.388 |
10.08 |
67 |
168 |
168 |
| 57 |
73.37 |
39.407 |
12.63 |
58 |
174 |
176 |
| 54 |
79.38 |
46.08 |
11.17 |
62 |
156 |
165 |
| 52 |
76.32 |
45.441 |
9.63 |
48 |
164 |
166 |
| 50 |
70.87 |
54.625 |
8.92 |
48 |
146 |
155 |
| 51 |
67.25 |
45.118 |
11.08 |
48 |
172 |
172 |
| 54 |
91.63 |
39.203 |
12.88 |
44 |
168 |
172 |
| 51 |
73.71 |
45.79 |
10.47 |
59 |
186 |
188 |
| 57 |
59.08 |
50.545 |
9.93 |
49 |
148 |
155 |
| 49 |
76.32 |
48.673 |
9.4 |
56 |
186 |
188 |
| 48 |
61.24 |
47.92 |
11.5 |
52 |
170 |
176 |
| 52 |
82.78 |
47.467 |
10.5 |
53 |
170 |
172 |