Question 1:
Consider the market for purchase of new cars.
(a) What factors likely influence the demand for cars? Identify at least four factors.
(b) If you were to draw a demand curve for cars, how would you label the axes-that is, what are you measuring along each axis? Would this demand curve slope up or down, be vertical, or be horizontal? Why?
(c) What factors likely affect the supply of cars? Identify at least three factors.
(d) If you were to graph the supply of cars, would it slope up or down, be vertical, or be horizontal? Why?
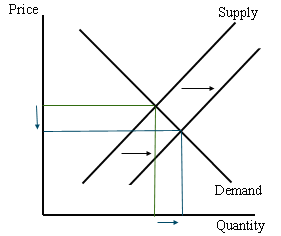
(e) If the cost of steel goes up, which (if either) of these curves might be affected? How? What will happen to the equilibrium price and quantity of cars? Why?
(f) If the cost of parking goes up, which (if either) of these curves might be affected? How? What will happen to the equilibrium price and quantity of cars? Why?
(g) The U.S. Environmental Protection Agency will require new light trucks and sport utility vehicles (SUVs) to install new pollution control devices that will increase their cost. For the purposes of this question and from the perspective of federal rules, these are not cars, even though people use them in the same way as they use cars. Which (if either) of the supply and/or demand curves for cars might be affected? How and why? What will happen to the equilibrium price and quantity of cars?
Question 2:
Now draw two demand curves on your figure. Draw one that is horizontal at P = $32/MWH and one that is vertical at quantity = 15,000 MWH.
(a) What happens to the equilibrium price when the supply curve shifts from S0 to S1 in each case?
(b) A horizontal demand curve means that consumers will buy any amount produced at a price of $32/MWH or less, but they will buy none if the price goes higher. A vertical demand curve means that consumers do not respond at all to price-they will buy the same quantity regardless of how much it costs. Which do you think is closer to how consumers buy electricity? That is, do consumers pay a lot of attention to price (the horizontal curve), or do they ignore price (the vertical curve)? Is it likely to be different in the short run v.s. in the long run (e.g. a few months v.s. a few years)?
(c) Consider the true demand curve in Figure 2.3. When the price increased, did the quantity demanded change a lot or a little? In light of your answer in (b), what does that tell you about the demand curve shown in the figure.
Question 3:
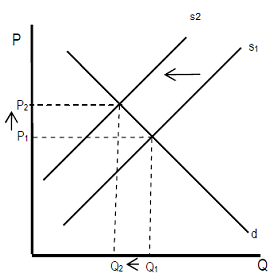
France produces about 75% of its electricity with nuclear power plants. However, in the wake of the Fukushima nuclear accident in Japan, the current French president François Hollande has pledged to phase out 24 of the country's old nuclear reactor. Suppose that these reactors are not immediately replaced by new power plants. In such case the phaseout would represent a decrease in supply for the French electricity market, leading to a lower quantity consumed and a higher price (see figure below).
(a) Since following the supply shift prices are now higher, should the supply curve partially shift back towards the right? Should demand shift to the left due to this price hike? Why or why not? (Hint : Think about the detailed process leading to the new equilibrium, as we did for the example of gas- powered generators during the Quebec ice storm)
(b) What if, as nuclear plants are being phased out, the cost of electric cars drops significantly? What will be the overall effect on the market for electricity?
Question 4 :
In class we discussed what will happen in the market for oil in Quebec if Enbridge is allowed to move forward with the reversal of the Line 9 pipeline. We saw that, because the pipeline grants access to the Quebec market to producers in central Canada, the project would result in an increase in the oil supply in the Quebec oil market. From the supply and demand graph below we see that it would benefit the Quebec economy through lower oil prices, but that it would also result in more oil being consumed, and thus more greenhouse gas emissions. Such an increase would make it harder for Quebec to meet its target of reducing its greenhouse gas emissions by 20% below 1990 levels before the end of 2020.
(a) Suppose that the Quebec government wants to impose an output quota to exactly offset this increase in greenhouse gas emissions so to not compromise its greenhouse gas reduction efforts.
Reproduce the graph below, and show clearly on the graph :
(i) What should be the amount of the quota
(ii) What price consumers will pay
(iii) What price suppliers will receive
In each case, show how you obtained your answer.
(b) With the output quota, does Quebec still benefits compared to before the reversal of the pipeline?
(c) Suppose that the government instead chooses to impose a tax on oil, again just enough to exactly offset the increase in greenhouse gas emissions caused by the project. Reproduce the graph again, and show clearly :
(i) What should be the amount of the tax
(ii) What price consumers will pay
(iii) What price suppliers will receive
In each case, show how you obtained your answer.
(d) With the tax, does Quebec still benefits compared to before the reversal of the pipeline?
(e) Based on what you have found above, which policy should the government choose? A tax or an output quota?