Complete the assignment:
Q1) The clinical stages of HIV-1 are divided into distinct phases: Eclipse phase, and Fiebig stages I, II, III, IV, V, and VI. Typically, patients proceed through the phases sequentially.
In a study involving HIV-1 infected individuals, what type of variable is the patient's Fiebig stage? Ordinal categorical.
o Ordinal categorical
o Nominal categorical
o Quantitativea
Q2) Breast-feeding mothers secrete calcium into their milk. Some of the calcium may come from their bones, so mothers may lose bone mineral. Researchers compared 47 breastfeeding women with 22 women of similar age who were neither pregnant nor lactating. They measured the percent change in the mineral content of the women's spines over three months to see if breast-feeding was associated with a decline in bone mineral content (negative values indicate decline).
a) The researchers compared breast-feeding women with non-breastfeeding women of similar age. Why is it important that the ages be similar? The ages should be similar to minimize confounding variables. If the ages were not the same, then the differences in mineral content could be attributed to age differences and not breastfeeding.
b) Suppose we find that, in these 69 women, bone mineral content does decline more in breastfeeding women than in non-breastfeeding controls. Can we generalize from these data? In other words, based on these data, are you willing to say that breastfeeding causes mineral loss in women generally? Briefly discuss any concerns you might have about making such statements based on these data. No, we should not generalize from these data. There are many other factors that are unaccounted for between the two study groups. For example, it might be that recent pregnancy (rather than breastfeeding itself) causes change in mineral content. To solve this, we might compare breastfeeding women vs. controls who were recently pregnant but not breastfeeding. There might also be other environmental reasons to account for the differences in bone mineral content. For example, mothers might be more stressed with a child and might not intake enough calcium, thus leading to a lower mineral content, rather than breastfeeding itself. Furthermore, the sample size is quite small to be able to generalize to a larger population.
c) The table below shows data from this study.
|
Breastfeeding
|
Percent change in the mineral content of women's spines
|
|
No
|
-2.2
|
|
No
|
-1.6
|
|
No
|
-1.5
|
|
No
|
-.6
|
|
No
|
-.4
|
|
No
|
-.4
|
|
No
|
-.4
|
|
No
|
-.2
|
|
No
|
-.1
|
|
No
|
-.1
|
|
No
|
-.1
|
|
No
|
0
|
|
No
|
.3
|
|
No
|
.7
|
|
No
|
.9
|
|
No
|
1
|
|
No
|
1.1
|
|
No
|
1.2
|
|
No
|
1.7
|
|
No
|
2.2
|
|
No
|
2.4
|
|
No
|
2.9
|
|
Yes
|
-8.3
|
|
Yes
|
-7.8
|
|
Yes
|
-7
|
|
Yes
|
-6.8
|
|
Yes
|
-6.8
|
|
Yes
|
-6.5
|
|
Yes
|
-6.5
|
|
Yes
|
-6.2
|
|
Yes
|
-5.9
|
|
Yes
|
-5.7
|
|
Yes
|
-5.6
|
|
Yes
|
-5.3
|
|
Yes
|
-5.3
|
|
Yes
|
-5.2
|
|
Yes
|
-5.2
|
|
Yes
|
-5.1
|
|
Yes
|
-4.9
|
|
Yes
|
-4.9
|
|
Yes
|
-4.7
|
|
Yes
|
-4.7
|
|
Yes
|
-4.4
|
|
Yes
|
-4.3
|
|
Yes
|
-4
|
|
Yes
|
-3.8
|
|
Yes
|
-3.6
|
|
Yes
|
-3.3
|
|
Yes
|
-3.1
|
|
Yes
|
-3
|
|
Yes
|
-2.7
|
|
Yes
|
-2.5
|
|
Yes
|
-2.5
|
|
Yes
|
-2.3
|
|
Yes
|
-2.2
|
|
Yes
|
-2.2
|
|
Yes
|
-2.1
|
|
Yes
|
-2.1
|
|
Yes
|
-2
|
|
Yes
|
-1.8
|
|
Yes
|
-1
|
|
Yes
|
-1
|
|
Yes
|
-.8
|
|
Yes
|
-.3
|
|
Yes
|
.2
|
|
Yes
|
.3
|
|
Yes
|
.4
|
|
Yes
|
1.7
|
|
Yes
|
2.2
|
i. What is the scale of measurement of each of the two variables?
ii. Separately by breastfeeding status, calculate a summary of the "center" of the percent change in mineral content. Comment on the comparison of these summaries between the two groups.
iii. Below are two histograms of the above data for the percent change in mineral content of the spine over 3 months, labeled Histogram 1 and Histogram 2. Indicate which of the following two statements is correct with regard to which groups of women the two histograms correspond to (assume the x-axis is the same for both plots).
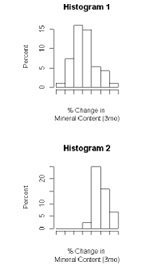
o Histogram 1 is breast-feeding women, Histogram 2 is Other women
o Histogram 1 is Other women, Histogram 2 is breast-feeding women
iv. Which of the following statements is correct:
o Percent change in mineral content is more variable in breast-feeding women
o Percent change in mineral content is more variable in Other women
v. Suggest one way that you might graphically display the information on the numbers of women in the two breast-feeding groups. Is this a useful summary?
vi. Histograms are used above to graphically display the percent change in mineral content for each group. Give one alternative graphical display that might be used to show percent change in mineral content for both groups in the same graph.
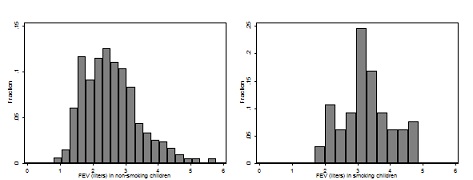
Q3) A researcher measured forced expiratory volume (FEV - a measure of lung capacity) in 654 children ages 3 to 19. About 10% of the participants reported being smokers. Here are histograms of FEV by smoking status. Clearly, FEV is higher for smokers. Do these data suggest that you can increase your FEV by smoking? Why or why not? (Note: FEV increases as you grow)
Q4) The National Cancer Society noted that cancer deaths in the US had increased from 331,000 in 1970 to 505,000 in 1990 to 539,000 in 1998 and said that additional funding was needed to develop more effective treatments to combat this "growing epidemic". Give at least 2 reasons why this increase might be observed even if cancer treatments have become more effective since 1970.
Q5) An ER doctor recorded the body temperature of 41 patients reporting flu-like symptoms on arrival. Their temperatures are reported in the stem-and-leaf plot below:
Body temperature (degrees F)
98. | 4 6 6 6 6 6 6 7 7 9
99. | 0 1 1 4
100.| 1 7 8 8 9 9
101.| 2 4 4 5 6 6 7 9
102.| 0 2 3 4 6 8 8
103.| 1 1 7 8
104.| 2 5
What are the median and the inter-quartile range of body temperature for the 41 cases?