Maximizing net benefits in the presence of an externality
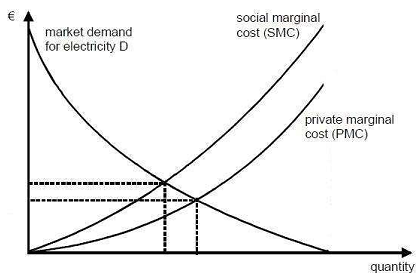
Below is a picture of the market for electricity in a european country.
a) What are the efficient price and quantity on this graph? What are the free-market price and quantity?
b) Reproduce the graph, and show on the graph the following :
i. The amount of the marginal external costs at the efficient outcome and at the free-market outcome. Call them respectively e*and e
m. Which is larger?
ii. The deadweight loss of the free-market outcome (explain how you obtained that answer)
c) Now draw this same graph, but in terms of the marginal cost and benefit of pollution. Here you can just sketch what the graph will look like : don't try to be too precise, just make sure that the curve look right qualitatively.
d) Now do the same thing, but in terms of marginal cost and benefit of abatement.
e) On your graphs for (c) and (d), indicate :
i. The efficient and free-market outcomes
ii. The amount of the marginal external costs at the efficient outcome and at the free-market outcome.
iii. The deadweight loss of the free-market outcome (explain how you obtained that answer)