Maximizing net benefits in the presence of an externality
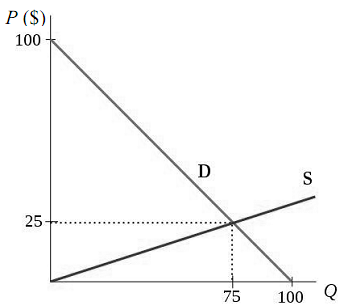
The graph shows the supply and demand for widgets in Utopia. Unfortunately, scientists in the country have just found out that the production of widgets creates an externality of 10$ per widget produced. As the government of the country always seeks to maximize net benefits (now you see why it's called Utopia!), the prime minister therefore decides to intervene by setting a tax on the production of widget.
a) What should be the amount of the tax? Draw a graph representing the situation.
b) The following year, scientists find out that the externality has increased to 12$ per widget, and will be increasing by 2$ per widget each year in the forseeable future. How should the government adapt its policy to respond to this new information?