Assignment 1:
1. In recent years, firms seeking to simplify the process of selling their products to busy customers have been turning to online apps, or Web-based application programs. One increasingly useful type of app for many small businesses is the quick-response (QR) app. Middlemen companies, such as Kaywa AT and Scanbuy, Inc, offer these apps.
The apps enable sellers to create codes they can place on poster ads. Consumers can scan the ads with their smartphones to place orders for the firm's products. For instance, an individual who is about to board a commuter train can use a smartphone to scan a code from the ad of a coffee shop near the train's destination. The code enables the smartphone to acquire the QR app, which in turn displays the coffee shop's menu, from which the individual can choose items to purchase remotely. The individual can then pick up those items at the coffee shop upon arrival-hence completing a mobile purchase made possible by a middlemen company that offers the QR app linking the individual to the coffee shop.
Why do you suppose that firms such as coffee shops are willing to pay fees to middlemen for ad codes to be used with QR apps?
2. For several years now, U.S. airlines have charged coach passengers to transport bags as separate cargo. This practice has induced many passengers to pack more items into carry-on bags that they stuff under seats or into overhead compartments.
American Airlines has been assigning coach boarding-group numbers randomly, rather than by groups of rows starting with the rear of the plane and ending with the front coach rows. Under the latter boarding method, many people with seats at the rear of a plane tend to place their carry-on bags in compartments near the front of the plane. Then people arriving in the front at the end of the boarding process spend time scrambling to find places to stow their carry-on. In contrast, under a randomized boarding process that ignores row locations, coach passengers are more likely to stow their bags near their seats. This mode of passenger behavior speeds the overall boarding process by several minutes, thereby ensuring that more flights depart on time.
Suppose the airline has established a system of boarding fees in which passengers wishing to be among the first to board a plane pay the highest fees. Would such a system likely reduce or lengthen boarding times? Why?
3. In recent years, the government of Pakistan has established a support price for wheat of about $0.20 per kilogram of wheat. At this price, consumers are willing to purchase 10 billion kilograms of wheat per year, while Pakistani farmers are willing to grow and harvest 18 billion kilograms of wheat per year. The government purchases and stores all surplus wheat.
a. What are annual consumer expenditures on the Pakistani wheat crop?
b. What are annual government expenditures on the Pakistani wheat crop?
c. How much, in total, do Pakistani wheat farmers receive for the wheat they produce?
d. Suppose that the market clearing price of Pakistani wheat in the absence of price supports is equal to $0.10 per kilogram. At this price, the quantity of wheat demanded is 12 billion kilograms. Under the government wheat price-support program, how much more is spent each year on wheat harvested in Pakistan than otherwise would have been spent in an unregulated market for Pakistani wheat?
4. The USPS operates a network of more than 31,000 post offices. The majority of these post offices do not generate revenues sufficiently high in relation to costs to justify keeping them in operation. If the USPS were truly a private firm, many of these post offices would be closed.
Until recently, what has enabled the USPS to keep these post offices operating in spite of their meager rates of profitability has been the receipt of an implicit subsidy in the form of protection from competition. The USPS is the only institution in the United States authorized to make regular deliveries of "non-urgent letters" to mailboxes of households, businesses, and government offices. Thus, the USPS faces no threat of being undersold by competitors in its primary business of delivering non-urgent mail.
In spite of these government protections of the USPS, the annual volume of mail handled by the USPS has fallen from 213 billion items per year in 2006 to about 165 billion items per year today. As a consequence, postage revenues at USPS have plummeted even as its labor expenses have remained nearly unchanged. Since 2007, the USPS has experienced average annual losses from its operations exceeding $7 billion per year.
What allows the USPS to continue operating without employee layoffs in spite of annual losses exceeding $120,000 per USPS worker per year? The answer is the sponsorship of U.S. taxpayers. The federal government continues lending funds to the USPS to enable it to keep providing the same level of services with an unchanged workforce. Few observers anticipate that the USPS will ever repay the loans, which likely will become explicit subsidies to this government-sponsored institution.
a. Why would a non-government-sponsored firm have difficulty remaining in operation incurring $7 billion in losses per year?
b. Why might a government-sponsored firm such as the USPS be more willing than a non-government-sponsored firm to agree to non-layoff contracts for workers?
Resources
1. For a discussion of the deteriorating situation at the USPS, go to Post Service.pdf.
2. Take a look at a list of contemplated USPS post office closings-but no planned employee layoffs at Post Office Closures.
Assignment 2:
1. Bureau of Labor Statistics: Employment and Unemployment
Navigation: Use the link at BLS.gov to visit the "Employment" page of the Bureau of Labor Statistics (BLS). Find to Labor Force Statistics in the Current Employment Statistics (CES).
Perform the indicated operations, and answer the following questions.
a. Retrieve data for Civilian Labor Force Level, Employment Level, and Unemployment Level. Can you identify periods of sharp cyclical swings? Do they show up in data for the labor force, employment, or unemployment?
b. Are cyclical factors important?
c. Select a price index. Take a look at the Consumer Price Index (CPI) at the BLS statistics on inflation in the All Items PDF file. Identify periods during which you index accelerated or decelerated (or even fell). Do the indexes ever provide opposing implications about inflation and deflation?
2. Figure 8-5 on Page 181 of your text displays the combined real GDP of Asia as a percentage of the combined real GDP of the entire world.
The figure displays this percentage according to two different measures. One measure uses prevailing exchange rates in currency markets to adjust all countries' real GDP levels to allow for comparisons. The other measure uses purchasing power parity adjustments.
Utilizing market exchange rates indicates that Asian real GDP's share of global real GDP generally rose steadily between 1980 and the mid-1990s from less than one-fifth to slightly more than one-fourth of global GDP. In contrast, purchasing power parity measures of real GDP indicate that Asia's measured share of the world economy has grown to more than 35 percent.
Another measure for comparing the relative "economic sizes" of Asia and the world is per capita real GDP. This measure also can be computed using either foreign exchange rates or purchasing power parities to allow for cross-country comparisons.
When per capita real GDP is computed using foreign exchange rates, Asian per capita real GDP is only 11 percent of global per capita real GDP. When the tabulation uses purchasing power parity adjustments, Asian per capita real GDP is 26 percent of global real GDP per capita.
Thus, both measures indicate that although Asia's economic size has risen in relation to the world as a whole, Asia's per capita real GDP remains relatively low. Even though Asian real GDP is relatively high, so is Asia's population, which is why the region's per capita real GDP remains only a fraction of the global level.
a. Why is there such a difference in Asia's share of global real GDP, depending on whether the computation uses purchasing power parities or exchange rates?
b. Why is Asia's "economic size" so much smaller on a per capita basis than on an absolute basis?
For a recent analysis of the growth of Asia's share of global economic activity, go to Asian Engine.
To learn about a recent claim that China's economy is already "larger" than the U.S. economy, go to China Ascendant.
3. Bureau of Labor Statistics: Multifactor Productivity Trends
Navigation: Use the link at Multifactor to visit the multifactor productivity home page of the Bureau of Labor Statistics.
Read the summary, and answer the following questions.
a. What does multifactor productivity measure? Based on your reading of this chapter, how does multifactor productivity relate to the determination of economic growth?
b. Click on Multifactor Productivity Trends in Manufacturing. According to these data, which industries have exhibited the greatest productivity growth in recent years?
Examine multifactor productivity data for the private business sector, the private nonfarm business sector, and the manufacturing sector. Identify periods when multifactor productivity growth was particularly fast or slow. Does it appear to make a big difference which sector one looks at when evaluating periods of greatest and least growth in multifactor productivity?
4. Part A. Consider the following table displaying annual growth rates for nations X, Y, and Z, each of which entered 2013 with real per capita GDP equal to $20,000.
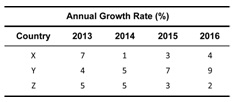
a. Which nation most likely experienced a sizable earthquake in late 2013 that destroyed a significant portion of its stock of capital goods, but was followed by speedy investments in rebuilding the nation's capital stock? What is this nation's per capita real GDP at the end of 2016, rounded to the nearest dollar?
b. Which nation most likely adopted policies in 2013 that encouraged a gradual shift in production from capital goods to consumption goods? What is this nation's per capita real GDP at the end of 2016, rounded to the nearest dollar?
c. Which nation most likely adopted policies in 2013 that encouraged a quick shift in production from consumption goods to capital goods? What is this nation's per capita real GDP at the end of 2016, rounded to the nearest dollar?
Part B. In 2014, a nation's population was 10 million. Its nominal GDP was $40 billion, and its price index was 100. In 2015, its population had increased to 12 million, its nominal GDP had risen to $57.6 billion, and its price index had increased to 120. What was this nation's economic growth rate during the year?