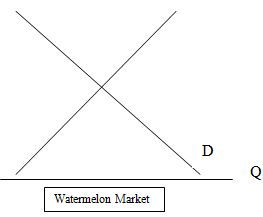
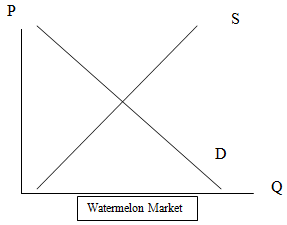
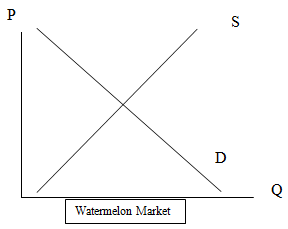
The next 3 parts to this question give changes that have occurred in the watermelon market. For each change in a determinant given, draw in the change that would occur on the supply/demand graph for watermelons that is provided.Be sure and review what causes the curve to shift and what causes a movement along the curve as well as what determinants affect supply and what affect demand. Once you have drawn in your change, write a short explanation for each question discussing what would be the new equilibrium price and quantity levels because of this change. In other words, has equilibrium price or quantity increased, decreased or stayed the same, etc. If P or Q are indeterminate - meaning you cannot tell whether it would have changed or not - be sure and explain that. (To draw in changes on the graph, simply use the Drawing toolbar and use lines or arrows to draw in your shifts or show movement along for supply or demand.)
A. A new technology is adopted that allows production of watermelons to be increased substantially.
B. There is a substantial decrease in the price of cantaloupes. Cantaloupes are assumed to be a substitute good for watermelons.
C. Consumer's income increases (assuming watermelon is a normal good) and the number of sellers producing watermelons increases.