Question 1: The graph below shows supply and demand curves for the Furby market before Furby toys were popular.
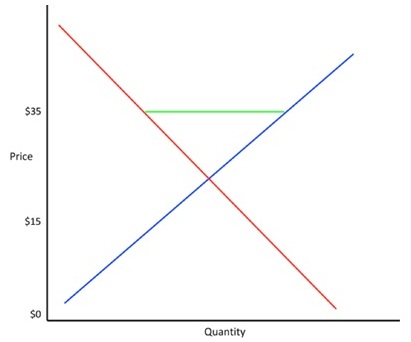
A. What does the blue line represent? What does the red line represent?
B. What is the space on the graph between the blue, green and red lines called? What does it represent?
C. Estimate the equilibrium point. What does it represent?
Question 2: Sketch a graph of supply-and-demand curves that depict the holiday season when the Furby craze took off, but Furby toys still retailed for $35. Use the same colors as above. Mark the area that represents the shortage with a green line.
A. Explain what changed between Graph 1 and Graph 2. Is the change in demand represented by a shift in the curve or a movement along the curve? What does this do to the equilibrium point?
B. Explain what a shortage is. Does Graph 2 help explain why people bought $300 Furby toys? What does it show us?
Question 3: Sketch a graph of what the supply-and-demand curves would look like if the producers of Furby responded to the increased demand by producing more Furby toys and continuing to sell them for $35.
How is Graph 3 different from Graph 2? What might the equilibrium point be now?
Question 4. It is 1998, and you own a toy store that sells Furby toys. You have a regular customer who buys your Furby toys and resells them online. She wants to buy your entire shipment of 100 Furby toys, but she can’t pay you for all of them until the next year. She approaches you and proposes two options:
a. If she can have the 100 Furby toys today, she will pay you $40 for each Furby one year from now.
b. If she can’t have the 100 Furby toys today, she will buy 80 Furby toys today at their normal price, $35 each. If you choose this option, you will put all the money from the sale into a one-year savings account that has a 6% interest rate.
Question 5. Assuming that there are no risks, which is the better deal for you? Use a calculator to determine the present value of both options. Write down all the numbers and symbols you enter into your calculator, any formulas you use and your final answers.
Question 6. At the height of the craze, Furby toys are doing so well that you consider investing in Hasbro (the company that makes Furby toys). Explain in your own words the difference between stocks and bonds and how the prices of each are determined.