Question 1:
A nutritionist is interested eating habits of college students. She asks a randomsample of college students whether they prepared a home-cooked Meal at least the proportion of once in the past week. She would like to determine if there is a difference between the proportion of male students and female students who prepared a home cooked meal in the past week.
a) State the null and alternative hypothesis for this experiment.
b) 50 males and 50 females were randomly sampled. 12 males and 21 females stated they prepared a home cooked meal in the past week. State the statistic and value of the statistic for the difference in proportions.
Use the Randomization distribution below to answer the next two parts of this question. The proportion of values at or below -0.180 and the proportion of values at or above 0.14 are each 0.047.
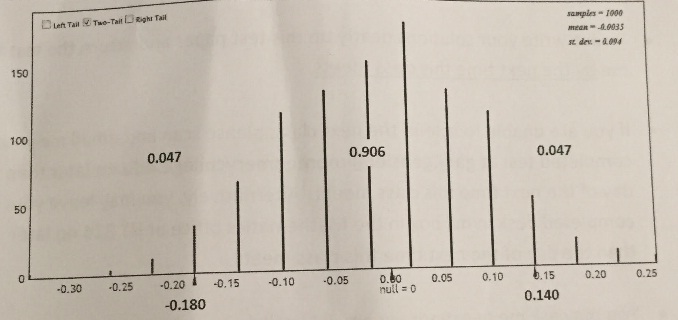
c) Please state the p-value for this experiment:
d) Using a significance level of α = 0.05, please state the conclusion of the experiment (circle one):
1. Reject Ho. The results are not statistically significant. We have insufficient evidence to conclude anything.
2. Do not reject Ho. The results are not statistically significant. We have insufficient evidence to conclude anything.
3. Reject Ho. The results are statistically significant. There is evidence of a difference between genders.
4. Do not reject Ho. The results are statistically significant. There is evidence of a difference between genders.
Question 2:
A real estate agent wishes to know the average monthly rent of an apartment in Manhattan. The agent takes a random sample of 20 apartments and determines the monthly rent for each. The monthly rent (in dollars) for each apartment in the sample is shown below:
2275 3995 2250 2325 1927 3150 2932 2300 2650 3100
1856 3290 4050 2225 2600 3200 3500 2900 4200 3305
A bootstrap distribution of the statistics of 1000 samples from the original sample is shown below.
Bootstrap Dotplot of mean:
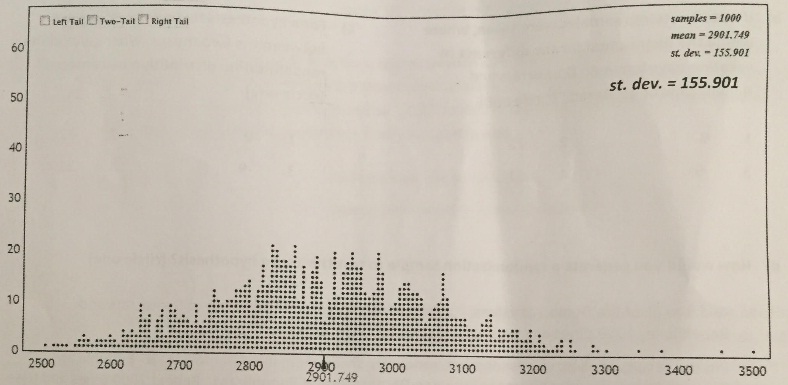
a) Construct a 95% confidence interval. Show your work. Round the confidence interval limits to one decimal place. Explain (in words) the meaning of the confidence interval in the appropriate context.
b) Which of the following are plausible values for the population mean? (circle all that apply)
1. 2600 2. 3305 3. 3200 4. 2932
c) Which of the following could be a 99% confidence interval based on the above bootstrap distribution? (circle one)
1. (2535.6, 3293.0) 3. (2695.3, 3103.7)
2. (2643.6, 3161.2) 4. None of these
Question 3:
A political science major wondered whether Democratic or Republican congressman take more vacationdays per year. A random sample of 40 memebres from each political party were drawn (40 Democrats & 40 republicans) and found that the mean number of vacation days taken by democrats sampled was 22 days and the mean number of vacation days by Republicans sampled was 21 days.
a) State the null and alternative hypothesis to answer the question as to whether there is a difference in vacation time between democrats and republicans.
b) If 1000 bootstrap samples were taken, where would the distribution for the difference in vacation days between Democrats and Republicans be centered? (circle one)
1. 0 2. 22 3. -9 4. 31
c) For a hypothesis testing the difference between the two means, where would the ranclomoinzelation distribution be centered? (circle one)
1. 0 2. 22 3. -9 4. 31
d) How would you generate a randomization sample to test the above hypothesis? (circle one)
1. Add 9 to all of the Democrat values, bootstrap from this modified sample of Democrats and Republicans 1000 times and base your test on this distribution.
2. Put the results of all 80 values together, randomly divide them into "Democrat" & "Republican" Groups. Find the mean difference between Democrats and Republicans. Repeat 1000 times and base your test on this distribution.
3. Flip a coin 80 times and count the number of heads as "Democrats" and the number tails as "Republicans". Repeat 1000 times and compared this distribution to the proportion 9/80.
4. Bootstrap from the Democrat values and bootstrap from the Republican values and take the difference from the mean of each bootstrap sample. Repeat 1000 times and base your test on this distribution.
e) A 99% confidence interval for the difference between the two means (Democrats - Republicans) is found to be -15 to -3. Indicate the conclusion of the test identified in part a) in the context of the example described at the top of the page and the significance level used.
Question 4:
A college student wishes to know the average number of hours college students study the weekend prior to final week of the fall semester. He takes a random sample of 200 college students and constructs a 95% bootstrap confidence interval based on 5,000 bootstrap statistics.
a) The student also constructs a 95% bootstrap confidence intervalfrom this random sample based on 10,000 bootstrap statistics. Compared to the 95% bootstrap confidence interval based on 5,000 bootstrap statistics, the 95% bootstrap confidence interval based on 10,000 bootstrap statistics.
1. Will be 1/4 the overall width
2. Will be about the same width
3. Will be half the overall width
4. Cannot tell from the information given of college students
b) The next semester (i.e., in the spring) he takes a larger random sample (i.e., larger than 200) of college students and constructs a 99% bootstrap confidence interval based on 5,000 bootstrap statistics. Compared to the 95% bootstrap confidence interval based on 5,000 bootstrap statistics (from the original random sample of 200), the 99% bootstrap confidence interval.... (circle one)
1. Will be wider.
2. Will be about the same width
3. Will be narrower.
4. cannot tell from the information below
Question 5:
The International Statistical Classification of Diseases and Related Health Problems version 9 (ICD-9) is a health care classification system, providing a system of numeric diagnostic codes for classifying diseases. For example, code 533 is the code for a peptic ulcer. In a double-blind randomized comparative study of an experimental treatment for arthritis (compared to a standard-of-care control group), the frequency of each of 120 commonly reported :onditions (documented as ICD-9 codes) were measured.
a) For each condition, a statistical test is performed to determine if there is a higher proportion of reports of the condition in the treatment group compared to the placebo group. Assume α = 0.075. If all of the null hypotheses are true, about how many of the hypothesis tests would reject the null?
b) It is determined that the only hypothesis test that actually rejects the null is for peptic ulcers. That is, a statistically significantly higher proportion of participants in the treatment group report peptic ulcers compared to participants in the placebo group. Explain whether you would recommend publishing this result.