Discussion:
Q: Rates of change apply to many different situations, not just distance-time or motion. While we have not discussed these specific types of problems, try and apply what you have learned about rates of change to response the questions.
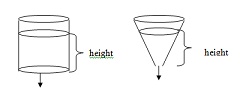
a. Water pours out of the bottom of a cylinder and out of a cylindrical cone (see diagram) at a constant rate. Sketch a graph that might show the height of the water as a function of time (height-time graph) first for the cylinder and then for the cylindrical cone.
b. There is a hole in a tank of water. A significant amount of water is pouring out of the hole. A special sealant is put into the tank. After a half an hour it starts to gradually clog up the hole until no more water leaks out. Sketch a graph of the amount of water in the tank as a function of time (amount of water-time graph) that would reasonably match the given description.