You are required to read and explore the case study and the data provided to you in order to prepare a simple statistical report. Statistical report is an organised synthesis of data that span a whole array of forms going from tables of numbers, measures to a text summarising the findings.
Statistical reports are particularly interesting because the readers can be overwhelmed by the huge amounts of information in raw format, and without an appropriate preliminary statistical analysis is difficult to make the important points stand out. Graphical display of data and text (explanations/interpretations) are two different yet powerful media that have to be well integrated in your report in order to achieve full potential.
The assignment consists of questions and/or data related to a simulated real world business case. Students need to analyse the case using appropriate statistical methods and tests in response to the questions in the case study using MS Excel data analysis tools. The assignment needs to be prepared in the MS Office Word with the attachments of the computer print- out of the results. The report must be typed with Introduction and conclusion about the case study in Microsoft Word format. The word limit is 1200 words (excluding tables, and figures) and students must strictly adhere to this word limit. Report must be typed in 12 point Time New Roman font, double spaced and 2.5 cm margins. Insert tables and graphical displays of your data analysis in the text where appropriate.
MY new job in HR- Case study
You have recently completed a Bachelor of Business degree through the College of Business, Law and Governance at James Cook University (JCU) and have been appointed as a junior member of the Human Resources (HR) team at JCU. This is your first full time position and you are on probation for three months. You feel a little anxious but you are keen to make a good impression in order to secure your position.
It is Monday morning. You are on your way to the office carrying your cup of coffee when your boss calls you into his office. He appears alarmed. He explains that the JCU board is holding an ‘extraordinary meeting’ and that the HR department is urgently required to provide information.
Information has been released from other Australian Universities which has captured the Vice Chancellor’s attention. This information relates to the turnover rate of staff. University X in QLD reported an overall successful retention rate of 65% for women and 72% for men over the course of 2004-2014. University Y in NSW reported about 55% retention rate with no significant difference between men and women. University Z in VIC reported 79% promotion rate showing that women were slightly more likely to get promotion than men but the difference was not statistically significant.
The Vice Chancellor (VC) noted that JCU has not conducted a similar study on the retention rate of staff and there appears to be no others in recent Higher Education literature. Hence, the VC is keen to understand the JCU retention rate (turnover rate). Such data and subsequent reports are important to the VC because the university is adopting a number of new and innovative hiring and promotion policies, including improving the retention rate for women employees. The VC is also keen to understand variations in the retention rate across Collegesand between campus locations. However before studying the retention rate, some preliminary studies need to be undertaken in order to investigate staff motivations.
Your boss asks:
Can you put together a statistical report about university staff and their general characteristics? I have sent you an email early this morning containing a dataset with all the information required for the report. You need to make sense of the data using your knowledge of descriptive statistical concepts to explain and summarise the staff information. There are specific questions to guide your investigation in the email I have sent.
As instructed, you go to your desk and open the ‘urgent’ email.
You find a set of questions accompanying the dataset and instructions for you to apply appropriate and various statistical techniques to address the questions. It is assumed that you know that a good statistical report starts with summarising data and identifying the variables and their types.
The email asks you to respond to the following questions:
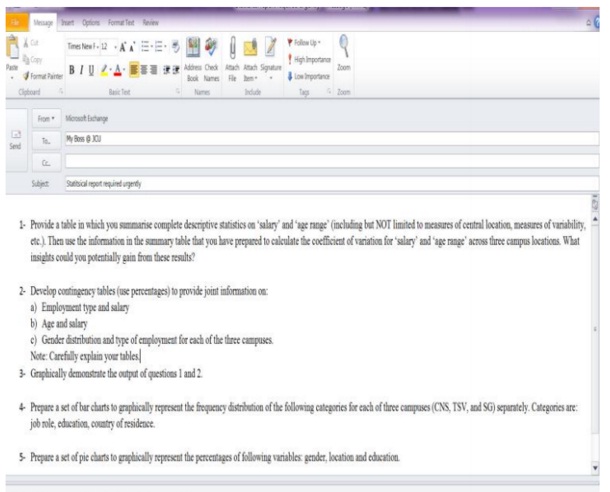
1- Provide a table in which you summarise complete descriptive statistics on ‘salary’ and ‘age range’ (including but NOT limited to measures of central location, measures of variability, etc.). Then use the information in the summary table that you have prepared to calculate the coefficient of variation for ‘salary’ and ‘age range’ across three campus locations. What insights could you potentially gain from these results?
2- Develop contingency tables (use percentages) to provide joint information on:
a) Employment type and salary
b) Age and salary
c) Gender distribution and type of employment for each of the three campuses.
Note: Carefully explain your tables.
3- Graphically demonstrate the output of questions 1 and 2.
4- Prepare a set of bar charts to graphically represent the frequency distribution of the following categories for each of three campuses (CNS, TSV, and SG) separately.
Categories are: job role, education, country of residence.
5- Prepare a set of pie charts to graphically represent the percentages of following variables: gender, location and education.
Variable description:
This document describes each of the variables listed in the excel spreadsheet in more detail:
- ID (each staff is given a unique ID number )
- Location(X1) (CSN = Cairns, TSV = Townsville, SG = Singapore)
- Gender(X2) (MALE, FEMALE)
- Academic Division / discipline area (X3): College of Arts (CA), College of Business, Law and Governance(CBLG), College of health science(CHS), College of Marine and environment(CME), College of medicine and dentistry(CMD), College of public health, medical and veterinary(CPHMV), College of Science, Technology & engineering (CSTE)
- Age(X4) : staff age in years old
- Education (X5) (Staff education: Post-Secondary level, Bachelor’s or equivalent level, Master’s degree or equivalent level, Doctoral or equivalent level)
- Salary(X6): staff annual salary in ‘000 dollars
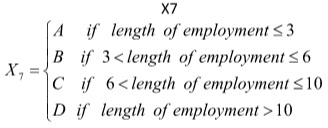
- Length of employment (X7): staff length of employment with JCU so far. This variable is coded as below:
- Employment type (X8): staff employment type with JCU : Contract, Full time, Part-time.
- Country of residence (X9): Staff country of normal residence : Australia, Singapore, Other
- Citizenship status (X10): staff citizenship: Australian, Singaporean, Other
- Job role (X11): Staff job role with the JCU : Professional, Academic, Research
- Mode of transport to work (X12) :Foot, Bike, Bus, Car
Attachment:- Explanation on your case study SP51 2016.docx