Assignment:
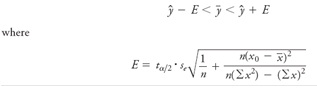
Confidence Interval for Mean Predicted Value Example shown below this section illustrated the procedure for finding a prediction interval for an individual value of y. When using a specific value x0 for predicting the mean of all values of y, the confidence interval is as follows:
The critical value ta/2 is found with n -2 degrees of freedom. Use the pizza/subway data from the Chapter Problem to find a 95% confidence interval estimate of the mean subway fare e given that the price of a slice of pizza is $2.25.
Example
Pizza Subway Fare Costs: Finding a Prediction Interval For the paired pizza subway fare costs from the Chapter Problem, we have found that for a pizza cost of $2.25, the best predicted cost of a subway fare is $2.16. Construct a 95% prediction interval for the cost of a subway fare, given that a slice of pizza costs $2.25.
Table in the Chapter Problem are listed below.
|
CPI
|
30.2
|
48.3
|
112.3
|
162.2
|
191.9
|
197.8
|
|
Subway Fare
|
0.15
|
0.35
|
1
|
1.35
|
1.5
|
2
|