Assignment:
Calculus and the Connecticut River
Whenever the Connecticut River reaches a level of 105 feet above sea level, two Northampton, Massachusetts flood control station operators begin a round the clock river watch. Every two hours they check the height of the river using a scale marked off in tenths of a foot, and record the data in a log book. In the spring of 1996, the flood watch lasted from April 4th, when the river reached 105 feet and was rising at 0.2 foot an hour until April 25th, when the level subsided again to 105 feet. Between those dates their log shows that the river rose and fell several times, at one point coming close to the 115 foot mark. If the river had reached 115 feet, the city would have closed down Mount Tom Road (route 5, south of Northampton).
The graph below shows the rate of change of the level of the river during one portion of the flood watch. Use the graph to answer each question.
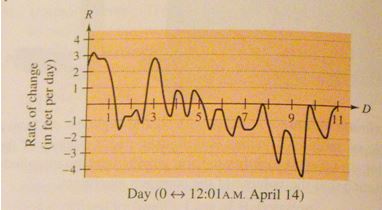
A) On what date was the river rising most rapidly? How do you know (please explain and show work) ?
B) On what date was the river falling most rapidly? How do you know (please explain and show work) ?
C) There were two dates in a row on which the river rose and fell, then rose again during the course of the day. On which days did this occur, and how do you know?
D) At one minute past midnight, April 14, the river level was 111.0 feet. Estimate its height 24 hours later and 48 hours later. Explain how you made your estimates.
E) The river crested at 114.4 feet. On what date do you think this occurred and why…explain?
Provide complete and step by step solution for the question and show calculations and use formulas.