Problem 1. The table below shows the prices and the consumption bundles in 2010 and 2011. Use 2010 as the base year to answer the following questions.
Goods Quantity in 2010 Price in 2010 Quantity in 2011 Price in 2011
Red Apples 10 $1 0 $2
Green Apples 0 $2 10 $1
a. Suppose that the government always takes the consumption bundle in 2010 as the market basket for calculating the CPI. What is the CPI for 2011?
b. Using the new consumption bundle in 2011, calculate the nominal spending and real spending in 2011 using 2010 as the base year. (Real spending is the total value of the consumption valued at the prices prevailing in the base year.)
c. If Emily only consumers the two goods, and she thinks of red apples and green apples as perfect substitutes, has the cost of living in the economy changed between 2010 and 2011? Explain your answer.
Problem 2. The table below lists the CPI, nominal, and real income for five cities. Calculate the missing value for each city, then use the completed table to answer the following questions.
City CPI Nominal Income Real Income
Denver 100 $50,000
Phoenix 102 $45,000
Los Angeles $70,000 $56,000
New York 210 $73,500
Dallas $48,300 $46,000
a. In which city would it take approximately $125 to purchase what $100 would buy in Denver?
b. How much would you have to earn (nominal income) in New York to have the same real income as you would have with a $50,000 nominal income in Denver?
c. How much would you have to earn (nominal income) in Dallas, in order to have the same real income as you would have with a nominal $70,000 salary in Los Angeles?
d. All else equal, if your boss offered you a 75% raise to move to New York from Phoenix, would you take the job?
Problem 3. Suppose that labor is paid a constant wage. That is, the firm is a price-taker in the labor market. Please complete the table below given the information provided, and answer the related questions.
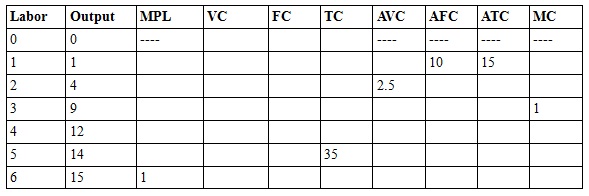
a. At what quantity of output is ATC at its minimum?
b. At what quantity of output is AVC at its minimum?
c. Suppose we know that within a certain range of output, ATC is decreasing as output increases. What must be true about ATC and MC? Explain your answer.
Problem 4. Suppose that the total short-run cost function of a firm is given by TC = 200 + 20Q, where TC is the total cost and Q is the total quantity of output.
a. What is the firm's fixed cost?
b. If the firm produces 100 units, what is its average total cost and average variable cost?
c. What is the marginal cost per unit produced if the firm is currently producing 100 units and decides to produce one additional unit?
d. Suppose the firm's fixed cost increases by $50, but its marginal costs fall to $15 per unit. What is the new total cost equation?
Problem 5. Serida lives in the North of Sparrowshire. Like all other residents of the country, she consumes barley seeds (B) and grilled grasshoppers (G). Sparrowshire was always proud of being able to maintain the low prices for these two goods: barley seeds cost 1 SSD (Sparrowshire Dollars) per ounce, and the grasshoppers are 2 SSD each. Serida is a well known singer in her part of country and earns 100 SSD per month.
a. Draw Serida’s budget line on a graph. Put barley seeds on the y-axis and grasshoppers on the x-axis. Mark the numerical value of the y-intercept, x-intercept and the slope. What is the equation of this budget line?
b. Serida decides that she wants to have 25 ounces of barley seeds and 40 grasshoppers every month. Is this bundle affordable for her? Does it exhaust her income? What if her choice is 15 ounces of barley seeds and 40 grasshoppers?
c. Local performers are gradually loosing in the competition with recognized international bands, and Serida’s income decreases to $50 while prices are the same as before. What is the equation of this new budget line? How does it compare to the budget line from part (a)?
d. Another world financial crisis reaches Sparrowshire, causing all prices to double from their original levels. What happens to Serida’s budget line (assume her income is 100 SSD as before)? How does it compare to the budget line from parts (a) and (c)?
e. The Duke of Sparrows declares a national campaign promoting the benefits of vegetarian diet. As a result, the price of barley seeds doubles from 1 SSD to 2 SSD per ounce while the price of grasshoppers remains at 2 SSD per grasshopper and Serida’s income remains 100 SSD. Draw the new budget line on your graph. What is the new equation for the budget line? How does it compare to the budget line from part (a)?
f. Serida retires and, trying to avoid unnecessary media attention, becomes very discreet about her income. It is known that the prices of barley seeds and grasshoppers have changed so that now Serida can only consume 60 ounces of barley seeds and 30 grasshoppers with her income. It is known that the price of barley seeds is still 1 SSD, and the price of grasshoppers is 3 SSD. What is Serida’s budget constraint after retirement?
Problem 6. Tina derives utility from consumption of sardines (S) and trout (T). The following graph shows her indifference curve map:
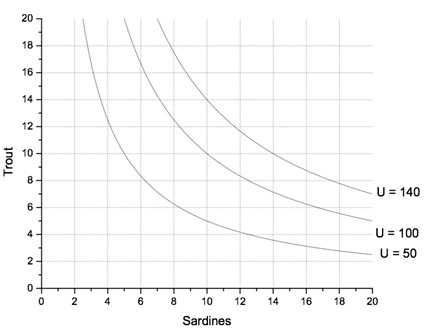
a. If at the utility level U = 140 Tina consumes 8 units of trout and decides to increase her consumption of trout by 2 units, how does her consumption of sardines change? [Here and in the following questions you may round the numbers to the nearest integer if the point on the graph does not seem to be exactly on the grid]
b. If at the utility level U = 140 Tina consumes 10 units of trout and decides to increase her consumption of trout by 2 units, how does her consumption of sardines change?
c. As Tina increases her consumption of trout while maintaining the same level of utility, what happens to the amount of sardines she is willing to give up in order to get one more unit of trout? What happens to the slope of the indifference curve, and what is the reason for the change in the slope of indifference curve?
d. If at the utility level U = 140 Tina consumes 10 units of trout and decides to increase her consumption by 2 units of trout while maintaining the level of utility at 140, what is the marginal rate of substitution?
e. Suppose the price of both trout and sardines is currently $10, and Tina’s income is $200. Add Tina’s budget constraint to the graph.
f. What consumption bundle will maximize Tina’s utility given the indifference curve map and the budget constraint from the previous question? What is the marginal rate of substitution at the optimal consumption point?
Problem 7. Tony likes nuts (N) and berries (B). He has a monthly income of $200 to spend on these two goods. The price of nuts stays at $4 around the year because nuts are so easy to store, but the price of berries varies a lot. Last year the price of berries was $5 in August; but in December it reached $8.
a. Write the equations of Tony’s budget lines in August and in December. Graph these budget lines (put nuts on the y-axis and berries on the x-axis).
b. Being a rational consumer, at August prices Tony purchased 25 nuts. How many berries did he consume in August? What was the marginal rate of substitution at the optimal consumption bundle?
c. After three months of price growth, in December Tony consumed 20 nuts. What was his consumption of berries? What kind of goods are berries and nuts for Tony?
d. It is known that Tony’s demand for berries is linear. Using your answers to questions (b) and (c), derive his demand function.