Question 1. Comparative Advantage
Two secret agents known only as A and B crash land on a (formerly) deserted island. While trapped on the island, they have a child whom they name C. In their quest for survival, the two goods they will need to produce are witty one-liners (jokes) and bandages. Food is unnecessary. A, B, and C are assumed to have the same amount of resources available to them and their individual production possibility frontiers are all linear.
A can produce 20 jokes and 0 bandages or 0 jokes and 5 bandages.
B can produce 10 jokes and 0 bandages or 0 jokes and 10 bandages.
C can produce 5 jokes and 0 bandages or 0 jokes and 1 bandage.
a) Assume A, B, and C all have constant opportunity cost. Draw their respective PPF's (with jokes on the y-axis and bandages on the x-axis), and write down an equation for each PPF .
b) Find the opportunity cost for A, B, and C of bandages and jokes.
c) Who has a comparative advantage for jokes over both other people on the island?
d) Draw the joint PPF for A, B, and C if they are allowed to trade with each other.
e) What happens if A and B have another child with constant opportunity cost? What if they have another and another and the population of the deserted island continues to grow? How will the shape of the joint PPF change? How will the intercepts of the PPF change?
Question 2. Supply and Demand
In order to make a pencil: we need a rubber eraser, a graphite rod, and wood. State whether the new equilibrium price and quantity is higher or lower in the market specified after the following changes (hint: you will find it helpful to draw a graph of the situation when 1 analyzing each of these events). Assume that each market is initially in equilibrium and that you are analyzing the effect of the described change on the equilibrium price and equilibrium quantity in that market.
a) Consider the market for rubber . Suppose the workers involved in the production of rubber unionize and all firms producing rubber must now pay their workers a higher wage.
b) Consider the market for graphite. Suppose a graphite mine is destroyed.
c) Consider the market for wood. Suppose the government decides to reduce the amount of deforestation by imposing a limit on how much wood may be produced (assume this limit is less than the current equilibrium quantity in the absence of restriction).
d) Consider the market for paper. Suppose the government policy in (c) is implemented (wood is used to make paper).
e) Consider the market for pencils . Suppose that all of the events described in (a), (b), (c), and (d) occur simultaneously.
Question 3. Investigation Question
Let’s see some economic theory in practice. Find a real world example in which a government (federal, state, municipality) implements a tax, subsidy, price ceiling, price floor or quota in a certain market. Describe in a couple of paragraphs the market that you are talking about and the type of government intervention or policy that is currently implemented. Then, try to analyze what would happen were the policy eliminated. (HINT: as a UW student there are some examples that directly affect you that you could use.) Obviously your answer here should differ from everyone else’s answer in the class since it is unlikely that you would pick precisely the same example as another student-make sure your answer is distinctly yours!
Question 4. International Trade
The country of Badgerland is a small, closed country but is well known as a sport lovers’ country. In particular, football is the most important sport for the people of Badgerland. The market for football t-shirts is large. The demand and the supply for football T-shirt are given by the following equations where Q is the quantity of t-shirts and P is the price per t-shirt:
Domestic Supply: Q = 20 + 2P
Domestic Demand: Q = 200 - 0.5P
a) Graph the demand and supply curves for t-shirts.
b) Calculate the equilibrium price and quantity 2
c) Calculate consumer surplus (CS), produce surplus (PS) and total surplus (TS) in this market.
The government of Badgerland decides to allow imported football t-shirts. The world price for football t- shirts is 50 dollars.
d) What price will t-shirts sell for in Badgerland if the market for t-shirts is opened? How many t-shirts will be sold in Badgerland once this market is open? How many t-shirts will be imported or exported when this market opens? Calculate the value of consumer surplus, CS, when this market is open to trade. Calculate the value of producer surplus, PS, when this market is open to trade. Does total surplus, TS, increase, decrease, or remain the same when this market opens to trade? (Hint: you may find it helpful to draw a graph of this market to guide your calculations.)
After the decision to open the country to international trade, the government of Badgerland is highly criticized. In particular, domestic producers claim that the new international products are worse in quality and that these foreign suppliers are stealing Badgerland jobs. They propose two possible policies to limit imports: a quota and a tariff.
e) The proposed tariff is 10 dollars on each imported t-shirt. Suppose the government implements this policy. How many t-shirts will be purchased in Badgerland? What price will these t-shirts sell for? How many t-shirts will be imported? How much revenue will the government get from the imposed tariff? Finally, what is the deadweight loss, DWL, due to the imposition of this tariff? (Hint: you will find it helpful to sketch a graph to guide your calculations.)
f) Suppose that instead of the tariff described in (e), the government decides to implement an import quota in this market. The proposed quota is a quota of 30 imported t-shirts. Find the new quantity of t-shirts that will be purchased and the price per t-shirt given this quota. Also, calculate the license holder revenue that will be generated by this import quota. Finally, what is the deadweight loss due to the imposition of this quota? (Hint: You may find it helpful to draw a graph of this quota to guide your calculations.)
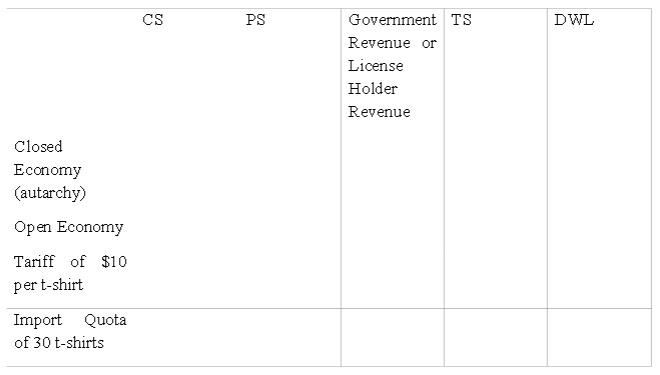
g) Compare the effect on CS, PS, TS, and DWL of the four possible policies considered in this problem: closed economy (autarchy), open economy, open economy with tariff of $10 per t-shirt, and open economy with an import quota of 30 t-shirts. Organize your results in a table like the following: