Problem 1. GDP and CPI Review
In Haye kingdom, four goods are produced: strawberries, shrimp, shovels and sandals. Consumers in Hayekingdom only buy strawberries and shrimp. The table below summariz es the quantities produced and the prices for these four goods in the years 2007 - 2009 .
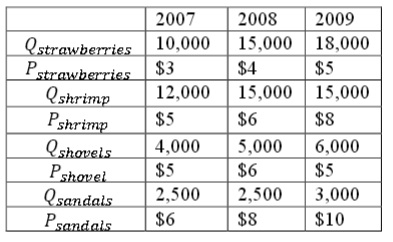
a) Calculate the nominal GDP for all thr ee years.
b). Using 2008 as the base year, calcul ate real GDP for all three years.
c). Calculate the GDP deflator for all three years using a 100 point scale and the c hange in the GDP deflator for 2007 - 2008 and 2008 - 2009 . Round your answers to the nearest hundredth.
d). Using 2008 as the base year, calculate the CPI for all three ye ars, assuming the representative consumer consumes 50 strawberries and 50 shrimp each year. Compute the change in the CPI for 2007 - 2008 and 2008 - 2009 . In your answer clearly delineate the steps you used to find the CPI.
e). Compare the percentage change in the GDP deflator you found in c) and the change in the CPI you found in d). Are they the same? Why or why not?
f). Given the CPI you calculated in d), if a resident’s nominal income in 2007 is $50,000, what does his nominal income have to be in 2009 in order for his real income to stay the same?
Problem 2. Long - run Economic Growth
For this question, you may need to use Excel or a similar spread sheet software . If y ou are not familiar with the software, there are lots of online resources and tutorials available. If you do not have such software installed on your computer, most computers in campus libraries have them available.
Imagine a simple economy in which there are only two factors of p roduction: capital (K) and labo r (L). The production function is given by Y = 5√KL . The capital stock in this economy is constant at . Use Excel or a similar spread sheet software to generate the following table. Note that you ne ed to generate output (Y), labor productivity (Y/L) and the MPL (change in Y/change in L) for all values of labo r between 1 and 100
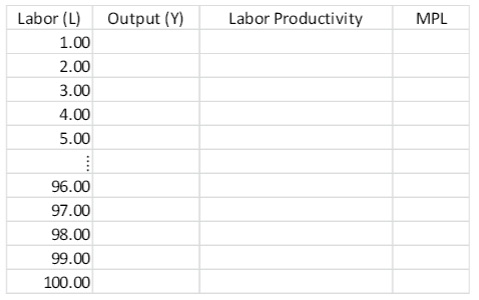
a). With the table you just generated, plot Y against L. (i.e. with Y on the y - axis and L on the x - axis)
b). How is the marginal product of labor reflected on the graph you just plotted? How does it change as the amount of labo r increase s ?
c). Holding capital constant, how does labor productivity change as labo r increases ?
d). Suppose there is an increase in the capital stock of the economy and now. Intuitively, what do you think will happen to labo r productivity and the marginal product of labor ? Briefly explain your reasoning for this intuition .
e) Using the new capital stock le vel, generate a new t able and plot a new graph to verify your intuition in d).
Problem 3. Rule of 70
Suppose there are two countries, A and B. In 2012, real GDP per capita in A was about $ 12,000, while it was about $ 48,000 in cou ntry B. Furthermore, suppose that real GDP per capita in country A grows at the rate of 10 percent per year and that real GDP per capita in country B grows at the rate of 5 percent per year.
a) How long will it take A’s real GDP per capita to reach the 2012 level of real GDP that B has?
b) Now A has a target of catching up to the level of B’s real GDP per capita by 2038 . Can A achieve this goal given the information you were given? Why or why not? (Hint: The real GDP per capita in both countries grow steadily at the rate of 10 perce nt and 5 percent, respectively .) You will find it helpful in your analysis of this question to fill in the table below based upon the rule of 70. (Hint some cells in this table you may want to leave empty since they will be more difficult to calculate and since you do not need the numerical value to answer the question being posed.)
2012 2019 2026 2033 2040
A $12,000
B $48,000
c) Suppose in 2026 a shock take pla ce in both countries such that the growth rate of real GDP per capita in country A is 14% per year going forward and in country B the growth rate of real GDP per capita is 7% per year going forward . Given these new annual growth rates, w ill country A realize its target by 2038? (Again, you will find it helpful to fill in the following table based upon the given growth rates: this time we left the year headings off so that you could think about what years you wanted to enter in the table. As before you may not need to enter a value in eve ry cell: the table is just meant to help you organize your analysis!)
2012 2019 2026
A $12,000
B $48,000
Problem 4. CPI and the Inflation Rate Use the CPI data given below to calculate the annual rate of inflation measured as a percent. The base year for the CPI in the table below is the period 1982 - 1984 (this range of years reflects the government’s use of a “chain weighted average”). In your answers round to the nearest tenth of a percent.
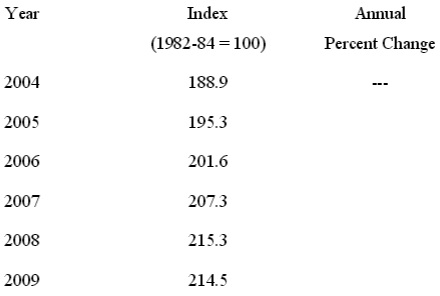
a) What was the annual rate of inflation during 2006? In your answer, show how you found your answer.
b) What was the percentage increase in the general level of prices between 2005 and 2009 ? What was the percentage increase in the general level of prices between the base year period of 1982 - 1984 and 2009 ? In your answers, show how you found your answers. c) How does unanticipated inflation in the U.S. negatively impac t the economy? In your answer consider the impact of unanticipated inflation on people living on fixed incomes, the impact of unanticipated inflation on business investments and the impact of unanticipated inflation on the amount of goods and services exp orted from and imported to the U.S
Problem 5. Nominal Price and Real Price
Table: Price of a Gallon of Regular Unleaded Gasoline
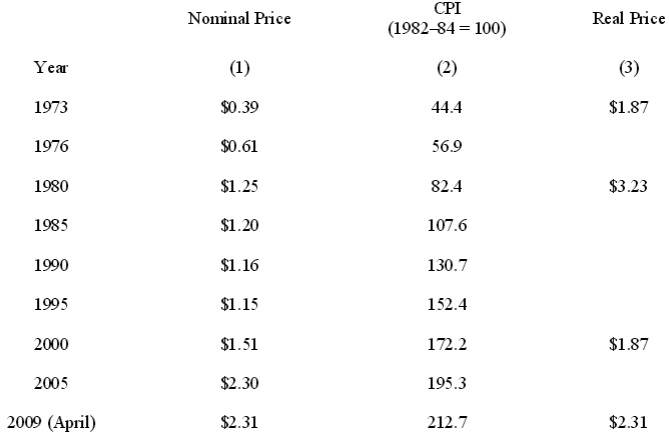
Source: U.S. Energy Information Administration, Monthly Energy Review The data for regular unleaded gasoline were unavailable prior to 1976. Thus, the 1973 observation is for regular leaded gasoline, which was slightly cheaper during that period.
Both crude oil prices and gasoline prices rose sharply throughout the 1970 s. By 1980, the nominal price of gasoline had risen to $1.25. This would make the real price of gasoline in 1980 measured in 2009 dollars equal to $3.23 ($1.25 times 2.6, the ratio of 212.7/82.4), even higher than the real price in 2009.
a) Measured in t erms of the general level of prices in April of 2009, derive the real price of a gallon of gasoline for the years 1976, 1985, 1990, 1995, and 2005. Show your calculations
b) Was the real price of a gallon of gas higher in April 2009 than in 1980? If the two prices are different, calculate the percentage difference in the two prices.
c) Was the real price of gas higher in April 2009 than in 1973?
d) Why would you want to convert current prices into real prices when making comparisons over time?