Bonds and Term Structure
The excel notebook BondsSreener.xlsx includes data for non-callable BB-rated bonds. The data was extracted from Yahoo's bond screener and reports transactions that occurred on May 15, 2014 (Settlement Date).
1. Graph the bond yield to maturity (YTM) on the y-axis of an XY-scatter plot, with the bond to maturity in years on the x-axis.
2. Use a polynomial regression of order three to determine the relation between the YTM and the bond maturity.
3. Identify two possibly mispriced bond issues, one overpriced and one underpriced. For each of these bonds estimate for how much it is mispriced relatively to the values represented by the model of the yield curve estimated in question 2.
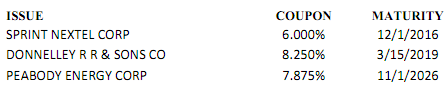
4. Compute the Macauley Duration for the following bond issues that are included in the dataset in Yahoo_bond_screener.xlsx (use the DURATION function) :
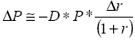
5. Assume that immediately after these calculations were done there was a parallel shift upwards in the term structure such that all rates were increased by 0.2%. Estimate the change in the prices of the bonds listed in question 4 (use the PRICE function).
Compute the actual change in price by estimating the new price for the new interest rate and compare with the value obtained from
Attachment:- BondScreener.xlsx