Use the following table to answer questions 1 and 2.
Fruitland produces only two fruits, apples and bananas. In the following table different feasible production combinations are given for Fruitland. Assume that the Production Possibility Frontier is linear between combinations A to B, B to C, C to D, etc.
Combination Apples (per week) Bananas (per week)
A 200 0
B 180 40
C 150 80
D 110 120
E 60 160
F 0 200
Problem 1. Fruitland’s Production Possibility Frontier exhibits
a. constant opportunity cost.
b. increasing opportunity cost.
c. decreasing opportunity cost.
d. both increasing and decreasing opportunity cost.
Problem 2. If Fruitland is currently producing 110 apples and 100 bananas per week, we know that:
a. Fruitland is not at an efficient level of production.
b. Fruitland is producing at a point inside its Production Possibility Frontier.
c. Fruitland could increase production of bananas without decreasing the production of apples.
d. All of the above statements are true.
Problem 3. Which of the following is a positive statement?
a. Elasticity is a measure of the responsiveness of quantity demanded to one of its determinants.
b. Government should be eliminated for the good of the economy.
c. People must think at the margin.
d. Society should prefer inflation to unemployment.
Problem 4. Any point inside the Production Possibility Frontier represents:
a. An efficient point.
b. An inefficient point.
c. A feasible point.
d. Answers (b.) and (c.) are both true.
Problem 5. Which of the following types of graphs would be best to illustrate the percentage of students from each state in Econ 101?
a. time-series graph
b. scatter diagram
c. pie chart
d. bar graph
Problem 6. What is the main purpose of making assumptions when making a model?
a. To explain what you expect from the model.
b. To focus on the purpose of your model.
c. To clarify what you are going to test with your model.
d. To simplify the scope of your model.
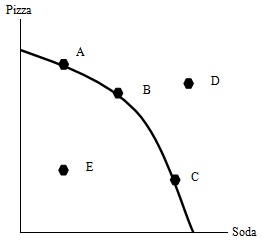
Problem 7. The above graph illustrates the PPF for Badgers. As we move from C to B to A, the opportunity cost of Pizza
a. falls.
b. rises.
c. stays constant.
d. falls and then rises.
Problem 8. Which of the following linear equations has the vertical intercept equal to 10 and the slope equal to -3 where the y variable is measured on the vertical axis?
a. x - 3y = -30
b. x + 3y = 30
c. 3x – y = -10
d. 3x + y = 10
Problem 9. Suppose that Tom and Jerry live in the secluded Islands. Tom is responsible for fishing and Jerry is responsible for picking apples. Suppose further that Tom gives 3 fish to Jerry in exchange for 15 apples. What is the price of fish?
a. 1/5 apples
b. 3 apples
c. 5 apples
d. 15 apples
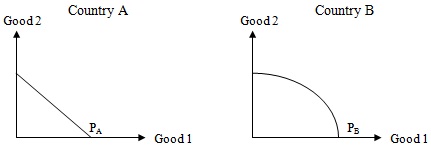
Problem 10. Consider the above two graphs. PA and PB both represent Production Possibilities Frontiers for countries A and B respectively. Which of the following statements is true?
a. In both cases the opportunity cost increases as more of one good is produced.
b. In the case of country A, the opportunity cost increases as more of one good is produced, while in the case of country B the opportunity cost decreases as more of one good is produced.
c. In the case of country A, the opportunity cost decreases as more of one good is produced, while in the case of country B the opportunity cost increases as more of one good is produced.
d. In the case of country A, the opportunity cost remains constant as more of one good is produced, while in the case of country B the opportunity cost increases as more of one good is produced.
Problem 11. A country can choose a consumption point during the current time period, which is outside of their PPF, when
a. There’s been a prolonged economic boom.
b. The population is increasing really fast.
c. It trades goods with another country.
d. Everyone in the country comes to a consensus that this point of production is the right point to produce.
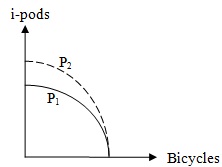
Problem 12. Consider the above figure. P1 is the Production Possibility Frontier for the city of Limassol. Limassol produces only two goods, i-pods and bicycles. Suppose that the Production Possibility Frontier P1 has shifted outwards to P2, in the same way that the figure illustrates. A possible explanation for this shift is: there has been
a. An increase in Limassol’s resources that can be used in both industries.
b. A technological improvement in the i-pod industry.
c. A technological improvement in the bicycle industry.
d. A government tax imposed on the production of i-pods.
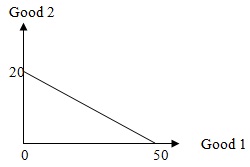
Problem 13. Consider the above graph. Which combination of Good 1 and Good 2 is feasible and efficient? (Good 1, Good 2)
a. (20,12)
b. (30,6)
c. (40,2)
d. (50,1)
Problem 14. It is in your best interest to specialize in those activities where your opportunity costs are
a. the lowest.
b. constant.
c. the highest.
d. decreasing.
For the following 2 questions, assume that in the U.S. the opportunity cost of coal is 1/3 barrel of oil and the opportunity cost of oil is 3 tons of coal. Assume that in England the opportunity cost of coal is 1/2 barrel of oil and the opportunity cost for oil is 2 tons of coal.
Problem 15. Who has the comparative advantage in producing coal and who has the comparative advantage in producing oil?
a. England has the comparative advantage in producing coal and the U.S. has the comparative advantage in producing oil.
b. England has the comparative advantage in producing coal and England also has the comparative advantage in producing oil.
c. The U.S. has the comparative advantage in producing coal and England has the comparative advantage in producing oil.
d. The U.S. has the comparative advantage in producing coal and the U.S. also has the comparative advantage in producing oil.
Problem 16. Which country should specialize in coal and which should specialize in oil assuming the U.S. and England trade only with each other?
a. The U.S. should specialize in coal and England should specialize in oil.
b. The England should specialize in coal and the U.S. should specialize in oil.
c. They both should specialize in coal.
d. They both should specialize in oil.
Problem 17. Which one of the following statements is true?
a. An individual should specialize according to comparative advantage.
b. An individual should trade with parties that have the same opportunity costs for the goods and services produced.
c. Comparative advantage exists whenever one person engaging in an activity incurs the same costs as some other individual.
d. An individual must be able to produce more of a good or service than someone else before she can have a comparative advantage in the production of that good or service.
Problem 18. If China has an absolute advantage in manufacturing clothing compared to the U.S. and clothing is traded between China and the U.S., then which one of the following statements must be true?
a. China can produce more clothing than the U.S.
b. China has a comparative advantage in clothing.
c. The U.S. should specialize in other goods besides clothing.
d. The U.S. should manufacture more clothing.
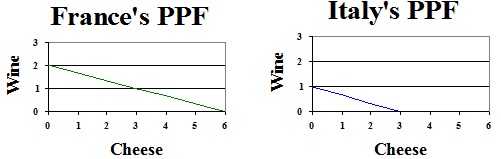
Problem 19. Two countries, France and Italy, have production possibility frontiers for the production of cheese and wine as given above. Which of the following statements is true?
a. France would benefit from specialization and trade.
b. Italy would benefit from specialization and trade.
c. Both countries would benefit from specialization and trade.
d. Neither country would benefit from specialization and trade.
Problem 20. John consumes two goods, potatoes and pineapples. When John’s income decreases, he buys more potatoes and less pineapple. Which of the following is correct?
a. Pineapple and potatoes are complements.
b. Pineapple and potatoes are substitutes.
c. Potatoes are an inferior good.
d. Pineapples are an inferior good.
Problem 21. As more industrial robots are installed in computer assembly lines, firms are able to produce more computers at lower cost. This causes the equilibrium price to ______ and quantity of computers to ______.
a. fall; fall
b. fall; rise
c. rise; fall
d. rise; rise
Problem 22. If demand shifts rightward and supply shifts leftward, then equilibrium
a. Quantity demanded goes up and so does price.
b. Quantity demanded changes in an indeterminate way and price goes down.
c. Quantity demanded changes in an indeterminate way and price goes up.
d. Quantity demanded goes up and price changes in an unknown way.
Use the following table to answer questions 23, 24 and 25.
Demand and supply in the cheese market in Maryville are given by the following:
If the price of cheese is $100 per unit, the total quantity demanded is 40(thousand). When the price goes down to $50 per unit, the total quantity demanded is 45 (thousand). On the supply side, when the price of cheese is $200 per unit, the total quantity supplied is 30 (thousand). When the price of cheese jumps to $700 per unit, the total quantity supplied is 80(thousand).
Problem 23. The equilibrium price in this market is
a. 100
b. 200
c. 400
d. 800
Problem 24. If the government sets up a price ceiling of $150, what will happen in the market?
a. There will be a shortage of 35000 units of cheese.
b. There will be a shortage of 10000 units of cheese.
c. There will be a shortage of 25000 units of cheese.
d. There will be a surplus of 25000 units of cheese.
Problem 25. Which of the following is least likely to result from rent controls that establish a below equilibrium price for rental housing?
a. A shortage of rental units in the market will develop and this will lead to black market activity in the rental housing market.
b. The quality of existing housing will deteriorate.
c. The future supply of rental housing will increase because the controls bring about excess demand.
d. People will change apartments less often.
Problem 26. A government-imposed maximum price at which a good can be sold is called a price
a. Floor.
b. Ceiling.
c. Support.
d. Maximum.
Problem 27. Consider the DVD player market. The market demand for DVD players is given by P= -2Q + 12. The market supply of DVD players is given by P=2/5Q. P is price and Q is the amount of DVD players. The government mandates a price floor for DVD players of $2 each. What happens?
a. There will be a surplus of 5.
b. There will be a shortage of 5.
c. 5 DVD players are traded.
d. There will be no exchange.
Use the following information to answer questions 28,29 and 30.
Bill can produce 10 left shoes in 2 days, or Bill can produce 10 right shoes in 4 days. Ted can produce 10 left shoes in 8 days, or Ted can produce 10 right shoes in 2 days.
Problem 28. What is the opportunity cost of one left shoe for Bill and Ted?
a. Bill: 2 right shoes Ted: 4 right shoes
b. Bill: 2 right shoes Ted: 1/4 right shoe
c. Bill: 1/2 right shoe Ted: 4 right shoes
d. Bill: 1/2 right shoe Ted: 1/4 right shoe
Problem 29. If Bill and Ted work independently, what is the maximum number of total pairs of shoes (one left shoe and one right shoe per pair) that they can produce in 60 days? (Note: Total pairs of shoes = Bill’s pairs of shoes plus Ted’s pairs of shoes.)
a. 120
b. 160
c. 240
d. 300
Problem 30. If Bill and Ted work together and specialize, what is the maximum number of total pairs of shoes that they can produce in 60 days?
a. 240
b. 300
c. 360
d. 600