Assignment:
Using the accompanying log-log graph, answer the following questions:
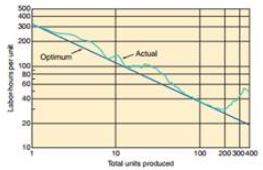
a) What are the implications for management if it has forecast its cost on the optimum line?
b) What could be causing the fluctuations above the optimum line?
c) If management forecasted the 10th unit on the optimum line, what was that forecast in hours?
d) If management built the 10th unit as indicated by the actual line, how many hours did it take?
Provide complete and step by step solution for the question and show calculations and use formulas.