Complete the following:
1) Find the median of the following set of numbers:
1, 4, 9, 15, 25, 36
(2) Find the mode of the following set of numbers:
41, 43, 56, 67, 69, 72
(3) Find the mode of the following set of numbers:
9, 8, 10, 9, 9, 10, 8
(4) A salesperson drove 238, 159, 87, 163, and 198 miles on a 5-day trip. What was the mean number of miles driver per day?
(5) The following scores were recorded on a 200-point final examination:
193, 185, 163, 186, 192, 135, 158, 174, 188, 172, 168, 183, 195, 165, 183.
a) Find the mean final examination score.
b) Find the median final examination score
c) Is the mean or median a more useful representative of the final examination scores? Write a brief paragraph justifying you response.
(6 - 13) For the problems below, use the following chart:
(6)What is the population of Europe in 2000?
(7)What is the total area of Europe?
(8)Compare the population per square mile in Asia to the population per square mile in North America for the year 2000.
(9)What is the percent increase in the population for all six inhabited continents, excluding Asia, from 1950 to 2000.,
(10)What was the percent increase in the population in South America from 1900 to 2000?
(11)What was the mean population of the six continents or land masses that were habitable in 2000?
(12)What was the mean population in 1950?
(13)What was the percent increase in the mean population from 1950 to 2000?
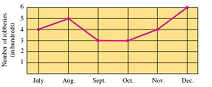
(14 - 15) Use the graph below to answer this question. It shows the number of robberies in a town during the last 6 months.
(14)How many robberies occurred in November?
(15)What was the mean number of robberies per month over the last 6 months?
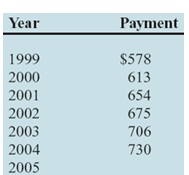
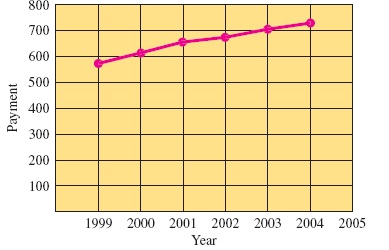
(16) Use the following graph and table to predict the payment for 2005:
(17) The table below gives the median earnings of women aged 25 and older who work full time, year round, by educational attainment, according to the 2000 census.
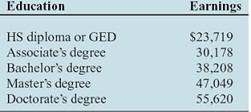
Create a bar graph using this information. You can use MS Excel or PowerPoint.
(18) The following pie chart shows the budget for a local company. The total budget is $600,000.
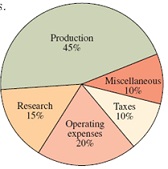
Find the amount budgeted in the "operating expenses" category.
(19) The following pie chart shows the distribution of a person's total yearly income of $24,000.
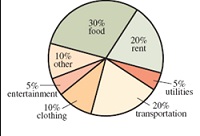
Find the amount budgeted for the category of Utilities.
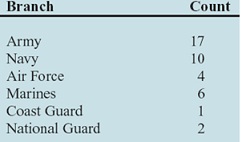
(20) The following table gives the number of Senate members with military service in the 106th Congress, by branch.
Construct a pie chart from this information.
(21) Find the median of the set of the following set of numbers:
26, 30, 38, 67, 59, 21, 17, 85, 22, 22
(22) Give the five number summary of the following set of numbers:
7, 7, 5, 4, 1,9, 8, 8, 8, 5, 2
(23) Find the range of the following set of numbers:
7, 7, 5, 4, 1, 9, 8, 8, 8, 5, 2