1. A psychologist, Dr. Bill Mikalek, administered a test of manual dexterity to 30 third-graders. The times, in minutes, required to complete the test are given below. Construct a frequency distribution (including class limits, class boundaries, class midpoints, tally, frequency, and cumulative frequency) for the data using five classes. (14 points; 3, 3, 2, 2, 2, 2 )
4 10 10 1 12 2 9 9 9 10
7 12 9 7 11 3 10 7 5 7
0 1 2 3 12 5 6 7 8 9
2. A questionnaire on Marital Status showed the following information obtained from 20 respondents. Construct a frequency distribution (including class, frequency, and percent.) (5 points)
S D D M D S L S M S
L M L S M S D L M S
3. Construct a histogram for the frequency distribution:
Class Bounds Frequency (5 points)
1 - 4 2
5 - 8 7
9 - 12 5
13 - 16 10
17 - 20 3
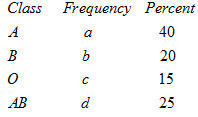
Construct a pie graph for blood types using the following information:
4. What is the median and mode of the following sample data set?
48, 42, 43, 50, 51, 60, 40, 60
5. Find the mean, and the median and modal classes of the following frequency distribution of 50 data items.
Class Frequency
26 10
27 14
28 13
29 10
30 0
31 3
6. What is the mean of the following sample data set?
3, 8, 7, 1, 4, 10, 2, 15, 20, 21
7. Find the range and variance of the following sample data set:
10, 16, 3, 17, 6, 2, 23, 40
8. A study was conducted, of 100 households, to determine the number of cell phones each household owns which found that houses had 0, 1, 2, 3, or 4 phones with probabilities of 0.2, 0.1, 0.4, 0.2, and 0.1, respectively. . Construct a probability distribution and draw a graph:
9. Find the mean and variance for the probability distribution:
# of units 1 2 3 4
Probability 0.1 0.1 0.6 0.2
10. If 32% of the people who take a certain drug have a negative reaction, find these binomial probabilities for a sample of 75 people: (6 points)
a) exactly 40 will react b) at most 25 will react
12. Find the mean and variance for the binomial distribution generated when one fair die is rolled 10 times and a success on each trial is when the face showing up is a 2 or a 3.
13. Find the area between z = -0.65 and z = 0.37
14. Find the area to the right of z = 2.35
15. Find the two z-score values that would contain the middle 71% of the area under the normal curve.