Assignment:
1. In a study to determine the average weight of a house cat, which of the following is the best sample? (a) A random selection of cats from a randomly selected neighborhood (b) All of the cats that a randomly selected veterinarian sees on a regular basis (c) All of the cats that a group of randomly selected veterinarians sees on a regular basis (d) Some of the cats in each of several neighborhoods.
2. Which of the following describes a study in which the participants naturally form groups by choice? (a) Single-blind experiment (b) Double-blind study (c) Case-control study (d) NONE OF THESE THREE.
3. A random sample of dog owners revealed that 72% of them walked their dog at least 3 times a week, with a margin of error of 8%. Which of the following can be stated with 95% confidence? (a) The actual percentage of dog owners who walk their dog at least 3 times a week is between 64% and 80% (b) The actual percentage of dog owners who walk their dog at least 3 times a week is between 72% and 80% (c) The actual percentage of dog owners who walk their dog at least 3 times a week is between 64% and 72% (d) The actual percentage of dog owners who walk their dog at least 3 times a week is 72%
4. Which of the following study results implies that there is a problem with the quality of education at Rydell High? (a) 25% of the senior class scored below average on the math portion of a national aptitude test, (b) 53% of the senior class was accepted for admission to Valley State College in the fall, (c) 83% of the seniors who applied for admission to Valley State College were accepted, (d) 30% of the senior class scored above average on the writing portion of a national aptitude test.
5. You hand a customer satisfaction questionnaire to every customer at a video store and ask them to fill it out and place it in a box after they check out. This study may suffer from what type of bias? (a) Selection Bias (b) Participation Bias (c) Variable Bias (d) No Bias Use the following table and corresponding pie chart, which describe the age distribution of U.S. senators in 1994, to answer questions 6 and 7.

|
Under 50
|
8
|
|
50-59
|
30
|
|
60-69
|
22
|
|
70 and over
|
40
|
6. Which region of the pie chart represents the number of senators between the ages of 50 and 59? (a) A (b)B (c)C (d)D
7. Which regions represent the number of senators under the age of 70?
(a) A & B (b) A, C & D (c) A, B, & C (d) A, B & D
The bar graph below shows the grades Ms. Jones gave the students in her Mathematics classes last year. Use it to answer questions 8 and-9.
8. If one centimeter represents 2 students, how much shorter is the bar for an A grade than the bar for a D grade?
(a) 0.25 cm (b) 8 cm (c) 4 cm (d) None of these three.
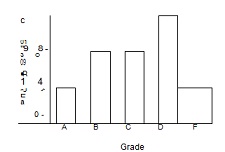
9. How many more students received a grade below C than received a grade of C or better?
(a) 12 (b) 18 (c) 28 (d) None of these three.
10. Which of the following exists when two variables tend to change in opposite directions, with one decreasing while the other increases?
(a) No correlation (b) Negative correlation (c) Positive correlation (d) Perfect correlation
11. Which of the following is likely the result of some common underlying cause? (a) Whenever I eat dessert, my weight increases (b) Whenever I get 8 hours of sleep at night, I don't get sleepy during the day (c) Whenever I get some cash at the ATM, my account balance decreases (d) Whenever I see snowmen, I also see smoke coming out of chimneys
12. Which of the following is not a guideline for establishing causality? (a) Consider only the suspected cause, ignoring other potential causes, (b) Find a physical model that explains how the cause produces the effect (c) If possible, test the suspected cause with an experiment (d) Seek evidence that larger amounts of the cause produce larger amounts of effect.
13. Find the mean of 66, 75, 53,91,86,96, 34,41,86,62. (a) 71 (b) 59 (c)69 (d) 70
14. Which of the following is most likely to be true of a right skewed unimodal distribution? (a) Mean < Median < Mode (b) Mode < Mean < Median (c) Mode < Median < Mean (d) Median < Mean < Mode
15. Find the median of the following set of data: 1, 2, 2, 3, 3, 4,4, 4,4, 7. (a) 3.5 (b) 3 (c) 7 (d) 4
16. FIND THE STANDAR DEVIATION OF THE DATA SET: 1, 1,-1,-1. (a)1
(b)2/square rout of 3 (c)2/3 (d)0
17. Suppose a data set from a normal population has a mean of 18 and a standard deviation of 3. Find the z - score for a data value of 12. (a) 6 (b) -2 (c) 97.72% (d) 2
18. Assume that a set of test scores is distributed according to the normal distribution with a mean of 67 and a standard deviation of 6. In what percentile is a score of 58?
(a) 93rdpercentile (b) 7th percentile (c) 16th percentile (d) 98th
19. A data set consists of the numbers: 1.1,1.6,1.8,1.8,2.0, 2.2, 2.6,2.8, 3.0. Find the five-number summary for the data.
(a)1.1,1.7,1.9,2.6,3.0 (b) 1.1,1.8,2.0,2.8,3.0 (c) 1.1,1.7,2.0,2.7, 3.0 (d) 1.1,1.7,2.1,2.6, 3.0
20. In what percentile is a data value that is 0.8 standard deviations below the mean? Ih
(a) 78.81th percentile
(b) 34.46th percentile
(c) 65.54m percentile
(d) 21.19m percentile
Table of z-Scores and Corresponding Percentiles
|
z-score
|
-3.0
|
-2.0
|
-1.5
|
-1.0
|
-0.9
|
-0.8
|
-0.7
|
-0.6
|
-0.5
|
|
percentile
|
LP_il3
|
2.28
|
6.68
|
15.87
|
18.41
|
21.19
|
24.20
|
27.43
|
30.85
|
|
z-score
|
-0.4
|
-0.3
|
-0.2
|
-0.1
|
0.0
|
0.1
|
0.2
|
0.3
|
0.4
|
|
percentile
|
34.46
|
38.21
|
42.07
|
46.02
|
50.00
|
53.98
|
57.93
|
61.79
|
65.54
|
|
z-score
|
0.5
|
0.6
|
0.7
|
0.8
|
0.9
|
1.0
|
1.5
|
2.0
|
3.0
|
|
percentile
|
69.15
|
72.57
|
75.80
|
78.81
|
81.59
|
84.13
|
93.32
|
97.72
|
99.87
|