Discuss the following:
Q1. The graph portrays the decision criterion for a hypothesis.
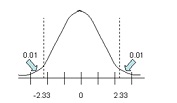
Determine the significance level.
Q2. Assume that the data has a normal distribution and the number of observations is greater than fifty. Find the critical z value used to test a null hypothesis if:
α= 0.05 and the test is right-tailed.
Q3. Use the given information to find the P-value.
The test statistic in a right-tailed test is z = 0.52.
Q4. For large numbers of degrees of freedom, the critical Χ2 values can be approximated as follows:
Χ2= 1/2(z+√2k-1)2
where k is the number of degrees of freedom and z is the critical value. To find the lower critical value, the negative z-value is used, to find the upper critical value, the positive z-value is used. Use this approximation to estimate the critical value of in a right-tailed hypothesis test with n=132 and =0.01