Please show all work:
Problem 1. A critical dimension of the service quality of a call center is the wait time of a caller to get to a sales representative. Periodically, random samples of 6 (n = 6) customer calls are measured for time. Results from the last eight samples are shown in the following table.
|
|
Observation (seconds)
|
|
Sample
|
1
|
2
|
3
|
4
|
5
|
6
|
|
1
|
425
|
408
|
422
|
380
|
410
|
401
|
|
2
|
440
|
450
|
431
|
447
|
422
|
430
|
|
3
|
402
|
428
|
419
|
434
|
433
|
425
|
|
4
|
375
|
400
|
395
|
420
|
380
|
385
|
|
5
|
408
|
407
|
407
|
435
|
411
|
405
|
|
6
|
398
|
417
|
400
|
418
|
402
|
425
|
|
7
|
410
|
435
|
395
|
397
|
390
|
410
|
|
8
|
395
|
402
|
397
|
408
|
400
|
415
|
A) Management is willing to use three-sigma limits. Use the data and Table (page 171) to determine the control limits for an R-chart and an x ¯-chart.
B) Plot sample means and ranges on their respective control charts. Are the process average and process variability in statistical control?
Problem 2: Please reference the following article, “Gate Turnaround at Southwest Airlines” (Pages 222-223) and answer the following two questions.
A) What is the key competitive priority of SWA? How does SWA's strategic capacity decisions support its competitive priority?
B) How would you define capacity and utilization for the airline industry? Discuss metrics that are important in defining an airline's capacity.
Problem 3: The figure below shows the call routing process for a customer service call center. Incoming calls are routed to work center B or C depending on the caller’s request.
The numbers in parentheses are the times in minutes for each step of the process.
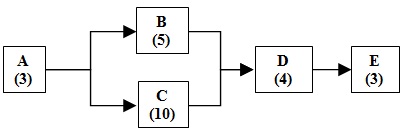
a) What is the capacity per hour for the A-B-D-E process route? Explain your answer.
b) What is the capacity per hour for the A-C-D-E process route? Explain your answer.
c) If 60% of the calls are routed to work center B and 40% are routed to work center C, what is the average capacity per hour for the process?
Problem 4: A company is setting up an assembly line to produce 90 units per hour. The table below identifies the work elements, times, and immediate predecessors.
|
Work Element
|
Time (Sec.)
|
Immediate Predecessor(s)
|
|
A
|
35
|
---
|
|
B
|
20
|
A
|
|
C
|
30
|
B
|
|
D
|
23
|
C
|
|
E
|
28
|
D
|
|
F
|
15
|
B
|
|
G
|
17
|
F
|
|
H
|
15
|
F
|
|
I
|
12
|
G,H
|
|
J
|
23
|
E,I
|
a) What cycle time is required to satisfy the required output?
b) What is the theoretical minimum number of stations?
c) Use one of the heuristic decision rules described in Table 7.3 on page 258 to balance the assembly line so that it will produce 90 units per hour. Clearly state which decision rule you are using and the work elements assigned to each station.
d) What is the efficiency of the line you found in part c?
Problem 5. Please reference the following article, “Lean Systems at Autoliv” (pages 303-304) and describe, in about one page, the JIT considerations presented in the chapter as they relate Autoliv’s manufacturing environment.
Problem 6. Observed monthly sales of a popular brand tennis shoe at a medium-sized sports store at the town’s mall over the first six months of the year are given in the following table.
|
Month
|
Jan
|
Feb
|
Mar
|
Apr
|
May
|
June
|
July
|
Aug
|
|
Demand
|
30
|
34
|
33
|
37
|
36
|
40
|
43
|
46
|
a) Use a three-month moving average method to forecast the sales for the months April through September. Also compute the mean squared error (MSE) based on the sales and forecasts for months April through August.
b) If the forecast for January was 30, determine the forecast for sales for the months February through September using an exponential smoothing method with α = 0.40. Also compute the mean squared error (MSE) based on the sales and forecasts for months April through August.
c) Which method would you recommend based on MSE? Why?