Learning Outcomes:
A. Apply technical knowledge and skills in creating information for the workplace using spreadsheets and relational databases
B. Communicate with IT professionals, stakeholders and user groups of information systems.
Context:
The spreadsheet is a powerful tool that has become entrenched in business processes worldwide. A working knowledge of Excel is a crucial skill for accountants. This assignment aims to assess the student's ability to create spreadsheets. Students will be using raw data and summarising them in a user friendly format to aid decision making. Students will need to recommend additional excel-based analysis that facilitates business decision making.
The Flying Store
Mark Richardson has recently opened an online store named The Flying Store. He sells a very popular model of drone called the 'Rocket Drone'. In an effort to widen his market, Mark has built a small website hosted by a web service provider. At the end of every week, the web service provider sends a data file to Mark that contains data about visitor traffic at his website. Mark would like to utilize this data to get insights on visitor usage of his website and he believes that the data would be valuable for business decision making. However, Mark lacks the technical knowledge to analyze and interpret this data and he is unsure how the results from the analyses can be used for making business decisions.
At the end of first week, Mark received a data file on visitor traffic. He decides to hire you so that you could assist him to analyze and interpret the data. The table 1 shows the first data file that Mark received on visitor usage of his website.
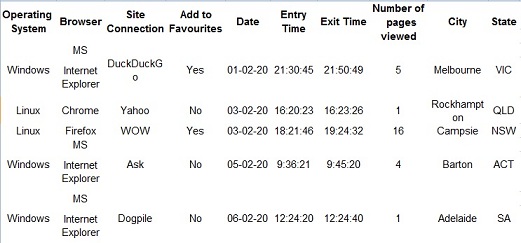
While Mark's website was visited only five times in the first week, Mark is expecting the number of visits to go up over time. Before the he gets more real data form the web service provider in the coming weeks, Mark wants to explore the possible analyses that can be done with this data. Mark handed you a document listing specific instructions on what he expects you to do in Excel. The instructions are listed below.
Requirements:
Question (1) Open an Excel Workbook and name it as 'Flying Store Analysis_your student ID' (i.e. Flying Store_00568578T'). Create a worksheet labelled as 'Visitor Data'. Make a table similar to the one above using hypothetical details for 50 visitors.
In your hypothetical data, assume: (a) all visitors accessed Mark's website from Australia, (b) at least 3 visitors accessed from each Australian states and territories (i.e. New South Wales, Queensland, South Australia, Victoria, Western Australia, Australian Capital Territory, Northern Territory), (c) All visits are made between 01/02/2020 and 28/02/2020. (d) Each visitor visits the website only once. So each row of data contains information about a specific visitor.
The table should include the following columns: Operating system, Browser, Site connection, Add to favourites, Date, Entry Time, Exist Time, Number of pages viewed, City, States.
Question (2) In the 'Visitor Data' worksheet, add a column labelled as 'Time Spent On Website'. This column should show the time that each visitor spends on Mark's website. The values for this column should be calculated by using the values of Entry Time and Exit Time columns. The values should be reported in the h:mm:ss format.
Question (3) Create a new worksheet in your workbook and label it as 'Visit Duration'. Report the descriptive statistics (i.e. mean, median, maximum, minimum) for Time Spent On Website and the Number of Pages Viewed using appropriate excel functions. The descriptive statistics should be linked to the 'Visitor Data' worksheet.
Include a table in this worksheet showing the total number of visits and the total number of viewed pages, by week. The values for each week should be directly calculated from the 'Visitor Data' worksheet. The table may look like Figure 2.
Visit Count/Viewed Pages
| |
Week 1
|
Week 2
|
Week 3
|
Week 4
|
Total
|
| |
|
|
|
|
|
|
Visit Count
|
30
|
46
|
32
|
49
|
157
|
|
Visited Pages
|
92
|
105
|
87
|
127
|
411
|
Mark mentioned, "I believe visitors are likely to visit more pages if they spend more time on my website". Do you find support for this belief? Calculate and report the results for correlation to support your answer.
Question (4) Create a worksheet labelled as 'Favourites'. Include a table in this worksheet showing how many visitors added Mark's website to their "Favourites" each week. The values should be directly linked to 'Visitor Data' worksheet. Your table may look like Figure 3.
Added as Favourite Link?
| |
Week 1
|
Week 2
|
Week 3
|
Week 4
|
Total
|
| |
|
|
|
|
|
|
Added
|
5
|
24
|
45
|
32
|
106
|
|
Not Added
|
0
|
5
|
20
|
14
|
39
|
|
Total
|
5
|
29
|
65
|
46
|
145
|
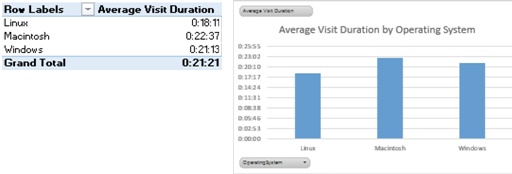
Question (5) Create a worksheet and label it as 'Pivot table and Charts'. Build tables and charts that show the average Visit Duration by Operating system, by Site Connection, by Browser and by State. Provide these by creating 4 pivot tables/charts (one for each Operating System, Site Connection, Browser and State). You will place all 4 of these on the same worksheet. A sample for output for Visit Duration by Operating system is shown in Figure 4.
Question (6) Mark noted, "I want to use the data on website visitors to develop my monthly budget. I have gathered the following information that I believe can be useful for budget development.
- 50% of the customers who spend more than 3 minutes on my website end up buying 1 drone. 20% of the customers who spend more than 5 minutes buy 2 drones.
- I buy each drone from a drone manufacturer for $450. The selling price for each drone is $600.
- Each drone is packed and delivered separately. Even for the customers who order multiple drones, I deliver each drone separately. Customers are not charged any additional delivery fees as I pay for the delivery. I deliver drones through StartTrack Delivery Services. The delivery costs vary across states. Their chart of delivery fees is listed below."
|
State
|
Delivery Cost
|
|
New South Wales
|
$45
|
|
Queensland
|
$35
|
|
South Australia
|
$55
|
|
Tasmania
|
$65
|
|
Victoria
|
$20
|
|
Western Australia
|
$35
|
|
Australian Capital
|
$45
|
|
Northern Territory
|
$35
|
Create a 'Budget Summary Report' worksheet. Include a table with a column for the state, estimated quantity, total incomes, total expenses and expected profit. The values for the estimated quantity column should be linked to the 'Visitor Data' worksheet. Use appropriate functions to fill out the remaining cells of the table. A sample table is shown in figure 5.
|
|
|
Total
|
|
|
|
State
|
Estimated Quantity
|
Income
|
Total Expenses
|
Expected Profit
|
|
New South Wales
|
21
|
12,600.00
|
10,395.00
|
2,205.00
|
|
Queensland
|
12
|
7,200.00
|
5,820.00
|
1,380.00
|
|
South Australia
|
10
|
6,000.00
|
5,050.00
|
950
|
|
Tasmania
|
13
|
7,800.00
|
6,695.00
|
1,105.00
|
|
Victoria
|
23
|
13,800.00
|
10,810.00
|
2,990.00
|
|
Western Australia
|
12
|
7,200.00
|
5,820.00
|
1,380.00
|
|
Australian Capital Territory
|
|
|
|
|
|
7
|
4,200.00
|
3,465.00
|
735
|
|
Northern Territory
|
3
|
1,800.00
|
1,455.00
|
345
|
|
Total Profit $ 11,090.00
|
Generate a pie chart to show the distribution of expected profits across different states.
Question (7) Create a worksheet labelled as 'Analysis and Recommendation'. This worksheet should contain the following three sections.
a. Findings - Briefly summarize your findings based on the analysis performed in requirement 2 to requirement 6.
b. Recommendation for additional analysis - In this section, you should comment on whether additional analyses can be performed using the types of data that Mark currently gets from the web service provider. You should provide two examples of additional analyses that can be performed using the given data and explain how to perform those analyses. Comment on how these additional analyses would help Mark to make business decisions.
c. Recommendation for additional data - Currently there is an option for Mark to get other types of data on his website visitors by paying an additional fee to the web service provider. Provide practical examples of two additional types of data that Mark should collect on his website visitors. Suggest the types of analyses that can be done using these additional data. Comment on how these analyses on additional data would help Mark to make business decisions.
Are you pursuing your graduation or post graduation from a renowned college or university in Accounting Information Systems course? Are you often struggling with your assignments and homework? Then connect with our Accounting Information Systems and live your academic life stress-free!
Tags: Accounting Information Systems Assignment Help, Accounting Information Systems Homework Help, Accounting Information Systems Coursework, Accounting Information Systems Solved Assignments
Attachment:- Accounting Information Systems.rar