Details and interpretation are must since this is just runing bunch of descriptives major part of score lies is analysis, interpretation and data explaination at each step.
The objective is to evaluate the association between normal versus high blood LDL-cholesterol levels (dependent variable) with BMI (predictor of interest), adjusting for other covariates. Organize the presentation of the project using the following list (steps should be conducted in order). You should present and describe the statistical results; make sure the presentation is organized and can be clearly followed.
Note: A detailed evaluation and interpretation at each step is necessary for this project for score.
Descriptive Analyses:
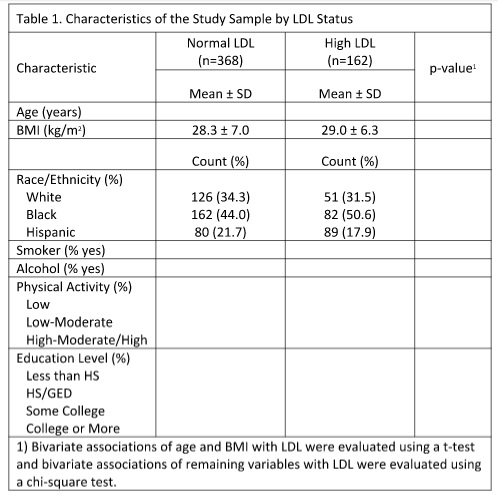
1. Conduct descriptive analyses and tests of bivariate associations between Blood LDL (normal versus high) and other variables so as to complete the Table 1. Write a discussion for the results in Table 1.
Model Specification and Diagnostics
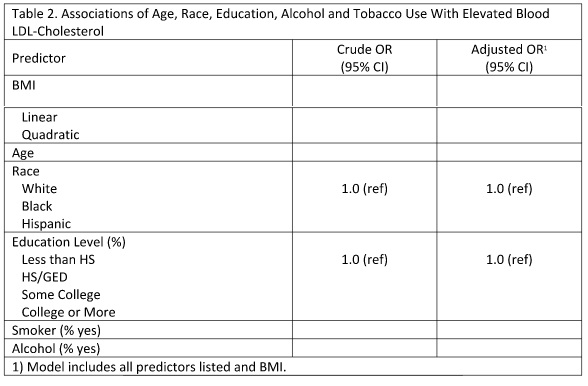
2. Start with a logistic model for the log odds of high LDL that contains BMI, age, race, education, physical activity, smoking status, and alcohol status (use mean-centered age and BMI for the remaining steps).
Describe the association of BMI with the odds of elevated LDL status this model implies.
3. Perform the following to evaluate the linearity assumption for BMI:
a. Use a component-plus-residual plots to initially evaluate linearity. Write a description to interpret the plot.
b. Use a quadratic term (use only a quadratic term to keep this simple) to model the non-linearity. Write a description to interpret the importance of the quadratic term.
c. Use a likelihood ratio test to evaluate the significance of the association between BMI and odds of high LDL in a model containing the linear and quadratic terms.
4. Evaluate the presence of influential data using the DFBETA statistic (also called Pregibon's dbeta). There should be an observation (obsno = 376; ID = 16113) with the highest DFBETA. For this observation, what is the DFBETA value? Describe what happens to the coefficient estimates for the predictor of interest when this observation is excluded from the logistic analysis. [In Stata, use an if statement to exclude an observation without deleting it]
Description of Results for the Logistic Model
5. Complete Table 2 for the predictor's age, race, education, smoking status, and alcohol status (note that the crude odds ratio for BMI comes from a model containing both the linear and quadratic terms only). Write a discussion for the results in Table 2.
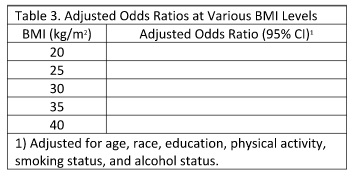
6. Use the Stata post-estimation commands below after running the logistic regression to calculate adjusted odds ratios and 95% CI's at the following BMI (kg/m2 names for BMI and BMI2 need to be those used in the logistic regression. The numbers in parentheses are) values: 20, 25, 30, 35, and 40. Note that the variable values for centered-BMI that approximate the desired (un-centered) BMI values. Present the results in Table 3 and write a description to interpret the results.
lincom c.cbmi*(-9) + c.cbmi2*(81), or
lincom c.cbmi*(-4) + c.cbmi2*(16), or
lincom c.cbmi*(1) + c.cbmi2*(1), or
lincom c.cbmi*(6) + c.cbmi2*(36), or
lincom c.cbmi*(11) + c.cbmi2*(121), or