Question 1:
a) The following table lists the values of a variable and their probabilities. Verify if the table represents a valid probability distribution, giving reasons for your answer.

b) Calculate the expected value and the standard deviation of X.
c) Determine P(-1 ≤ X < 1)
Question 2: Laboratory tests on a large shipment [several thousands] of radios revealed that 6.5% are defective. On arrival of the shipment at the local distributor, 30 of the radios were randomly selected for a promotion.
a) Define the random variable for this situation and list its values.
b)
- What in your view is the probability distribution of this variable? State the conditions that influence your choice of distribution.
- Calculate the probability that at most two (2) radios will be defective.
c) From a randomly selected sample of 200 radios from the shipment, what is the probability that less than 20 are defective?
Question 3: On a given week day, customers join a line at the teller window in a credit union at a rate of 12 per hour. The number of customers arriving at this teller line during any given hour on Fridays follows a Poisson probability distribution.
a) Define the random variable in this situation and list all its possible values.
b) State the value(s) of the parameter(s) of the distribution described above.
c) Calculate the probability that between 9 to 11 customers inclusive will join the teller line during the first hour of next week Friday.
d) Calculate the probability that 30 customers will join the teller line during the first two hours of next week Friday.
Question 4:
a) A survey was conducted to measure the number of hours per week adults spend on home computers. In the survey, the number of hours was normally distributed, with a mean of 8 hours and a standard deviation of 1 hour. A survey participant is randomly selected. Find the probability that the hours spent on the home computer by the participant are between 5.5 and 9.5 hours per week.
b) The grades for the Statistics final exam of a large class are normally distributed with a mean of 42 and a standard deviation of 16. The examiner is to assign Grades according to the following rule:
Grade A: top 10%
Grade B: the next 20%
Grade C: the middle 40%
Grade D: the next 20%
Grade F: the bottom 10%
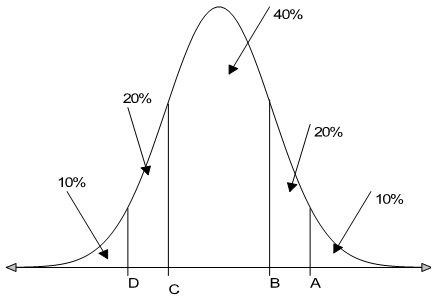
Find the lowest score on the final exam that would qualify a student for a Grade B?