Question: A busy landscaping supplies company sells wood chips for garden mulch. The mulch is sold by the cubic meter and delivered to households in a small truck. Each and every truckload is expected to be 4 cubic meters. The company decides to conduct an audit of actual load volumes through measuring a sample of loads for a two-week period. The data file Mulch.xls contains the volume (in cubic meters) from a sample of 368 truckloads of cypress pine wood chips and 330 truckloads of cedar wood chips.
a) For cypress pine wood chips, construct a 95% confidence interval estimate of the mean volume.
b) For cedar wood chips, construct a 95% confidence interval estimate of the mean volume.
c) The company is interested to know whether there is a linear relationship among the delivery volumes for the two kinds of wood chips. Compute a correlation coefficient for the first 330 pairs of observations and test whether this relationship is important at 1% level. Make sure you state the hypotheses which you are testing.
d) Based on the outcomes of (a) and (b), what conclusions can you reach concerning mean volume of the cypress pine wood chips and cedar wood chips?
Question: In a random sample of 25 observations from a normal population, we determine that the sample mean = 140, and the sample standard deviation = 10. By using a level of significance of 0.05, test the hypothesis that the population mean is 150.
You are needed to:
a) State the kind of test which you are going to use.
b) State the hypotheses which you are going to test.
c) Compute the standard error.
d) Compute the t-statistic.
e) Compute the p-value.
f) Draw your conclusion.
g) Find out the 95% confidence interval of the population mean and state whether it supports your conclusion given in f) above.
Question: The fill amount of soft drink bottles is usually distributed with a mean of 2.0 liters and a standard deviation of 0.05 liters. If you choose a random sample of 25 bottles, what is the probability that the sample mean will be?
a) Between 1.99 and 2.0 liters?
b) Below 1.98 liters?
c) Above 2.01 liters?
d) The probability is 99% that the sample mean will contain at least how much soft drink?
Question: It is believed that a linear relationship exists among Salary (the dependent variable) and the employees experience measured in years (the independent variable) for Diploma graduates. By using the summary data from a sample of 10 employees: experience = 93, = 975, salary = 1014, = 105104, = 9922
a) Provide the regression line equation for this sample. Interpret the coefficient and the intercept.
b) Compute the standard error of estimate and explain what it tells you about the model fit.
c) Test to find out whether there is adequate evidence to infer that a linear relationship exists between experience and salary at the 0.01 significance level. Make sure you state the hypotheses which you are testing.
d) Use your model to forecast the expected salary where an employee has 15 years of experience or state why it is not possible to do so.
Question: A transport company wishes to predict the price of petrol based on international crude oil prices. They record average monthly petrol prices and crude oil prices over a 12 month period.
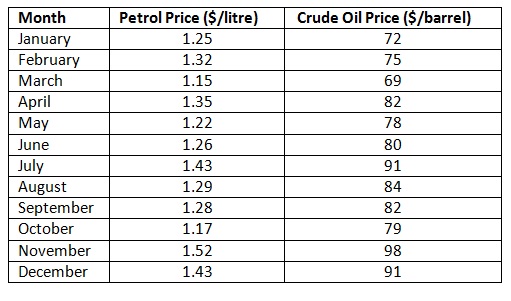
a) Plot a scatter diagram and, assuming a linear relationship, use the least-squares technique to compute the regression equation for this data. You will require to show your calculations for SSX, SSXY and
b) Interpret the meaning of the Y intercept, and the slope in this problem.
c) Use the prediction equation developed in (a) to forecast the petrol price if crude oil is $75 per barrel.
d) Compute the coefficient of determination, r2, and interpret its meaning in this problem.
e) Perform a residual analysis on your outcomes and found out whether the sample data meet the linear regression supposition of equal variance (homoscedasticity).
f) At 0.05 level of significance, is there evidence of a linear relationship among petrol and crude prices? Make sure that you state the hypotheses you are testing.
g) Construct a 95% confidence interval of the population slope.