--%>

Area Functions & Theorem

Area Functions

1. (a) Draw the line y = 2t + 1 and use geometry to find the area under this line, above the t - axis, and between the vertical lines t = 1 and t = 3.

(b) If x > 1, let A(x) be the area of the region that lies under the line y = 2t + 1 between t = 1 and t = x. Sketch this region and use geometry to find an expression for A(x).

(c) Differentiate the area function A(x). What do you notice?

2. (a) If 0 < x < π, let

1895_999.png

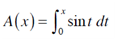
where A(x) represents the area of a region. Sketch the region.

(b) Use the Evaluation Theorem to find an expression for A(x).

(c) Find A'(x). What do you notice?

(d) If x is any number between 0 and π, and h is a small positive number, then A(x + h) - A(x) represents the area of a region. Describe and sketch the region.

(e) Draw a rectangle that approximates the region in part (d). By comparing the areas of these two regions, show that

A(x + h) ! A(x)/h ≈ sin x

(f) Use part (e) to give an intuitive explanation for the result of part (c).

3. (a) Draw the graph of the function f (x) = cos(x2) in the viewing rectangle [0, 2] by [-1.25, 1.25].

(b) If we define a new function g by

1733_9999.png

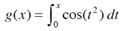
then g(x) is the area under the graph of f from 0 to x [until f(x) becomes negative, at which point g(x) becomes a difference of areas]. Use part (a) to determine the value of x a t which g(x) starts to decrease. [Unlike the integral in Problem 2, it is impossible to evaluate the integral defining g to obtain an explicit expression for g(x).]

(c) Use the integration command on your calculator or computer to estimate g(0.2), g(0.6), ..., g(1.8), g(2). Then use these values to sketch a graph of g.

(d) Use your graph of g from part (c) to sketch the graph of g' using the interpretation of g'(x) as the slope of a tangent line. How does the graph of g' compare with the graph of f?

4. Suppose f is a continuous function on the interval [a, b] and we define a new function g by the equation

651_99999.png

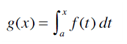
 Based on your results in Problems 1-3, conjecture an expression for g'(x).

   Related Questions in Mathematics

  • Q : Simulation with Arena An office of

    An office of state license bureau has two types of arrivals. Individuals interested in purchasing new plates are characterized to have inter-arrival times distributed as EXPO(6.8) and service times as TRIA(808, 13.7, 15.2); all times are in minutes. Individuals who want to renew or apply for a new d

  • Q : Containee problem For queries Q 1 and Q

    For queries Q1 and Q2, we say Q1 is containedin Q2, denoted Q1 C Q2, iff Q1(D) C Q2

  • Q : Graph Theory is the n-Dimensional Qn

    is the n-Dimensional Qn Hamiltonian? Prove tour answer

  • Q : Ordinary Differential Equation or ODE

    What is an Ordinary Differential Equation (ODE)?

  • Q : Statistics math Detailed explanation of

    Detailed explanation of requirements for Part C-1 The assignment states the following requirement for Part 1, which is due at the end of Week 4: “Choose a topic from your field of study. Keep in mind you will need to collect at least [sic] 3- points of data for this project. Construct the sheet y

  • Q : Who derived the Black–Scholes Equation

    Who derived the Black–Scholes Equation?

  • Q : Problem on Linear equations Anny, Betti

    Anny, Betti and Karol went to their local produce store to bpought some fruit. Anny bought 1 pound of apples and 2 pounds of bananas and paid $2.11.  Betti bought 2 pounds of apples and 1 pound of grapes and paid $4.06.  Karol bought 1 pound of bananas and 2

  • Q : Problem on mass balance law Using the

    Using the mass balance law approach, write down a set of word equations to model the transport of lead concentration. A) Draw a compartmental model to represent  the diffusion of lead through the lungs and the bloodstream.

  • Q : Use MS Excel to do the computations

    Select a dataset of your interest (preferably related to your company/job), containing one variable and atleast 100 data points. [Example: Annual profit figures of 100 companies for the last financial year]. Once you select the data, you should compute 4-5 summary sta

  • Q : Statistics Caterer determines that 37%

    Caterer determines that 37% of people who sampled the food thought it was delicious. A random sample of 144 out of population of 5000. The 144 are asked to sample the food. If P-hat is the proportion saying that the food is delicious, what is the mean of the sampling distribution p-hat?