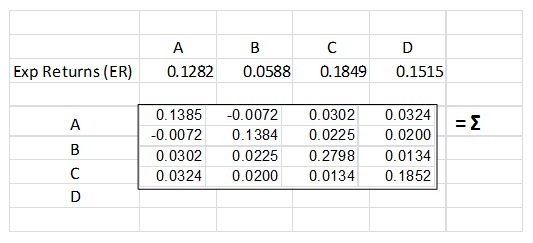
1) Use the variance-covariance matrix (∑) and the expected return vector (er) given in the table below, compute the set of weights which correspond to the portfolio that maximizes the Sharpe Ratio assuming a risk free rate of return of 3% per year, subject only to the constraint that the sum of the weights must be 1.
2) For the portfolio derived in (1) above, calculate the expected annual return and the annual standard deviation for that portfolio. Also compute the Sharpe Ratio.
3) For each of the individual assets which comprise the optimal portfolio which you determined in (1) and (2) above, compute the ratio of the expected return for each asset in excess of the risk-free rate to the marginal variance for that asset. Compare these values with the corresponding value for the portfolio as a whole. Is this what you expected? Why or why not?
4) Use the results calculated above, if an investor has a risk aversion factor of 1.3 (A), identify his investment allocation to each individual asset included in his overall portfolio. What is his expected return? What is the standard deviation of that portfolio?
5) Repeat problem (4), but for an investor with a risk tolerance factor of 3.8 (A). Do the differences among the portfolio determined in (5) and the portfolio determined in (6) make sense? Why or why not?
6) Say that you run a well-diversified mutual fund and the expected return on that fund is 16.2% and the standard deviation of that fund is 30.7%. What is the largest fee which you can charge annually for investors wanting to invest in your fund in order for investors to be indifferent among investing in your fund or in the optimal portfolio which you determined in step (2)?
7) Compute the betas for each of the individual assets that comprise the optimal portfolio with respect to that optimal portfolio.
8) Compute the expected returns using the betas that you determined in (8) and the market expected return that you calculated in (2). The risk free rate is still 3%. Are these expected returns consistent with the input data?