Part A:
Introduction:
Christina bought into a pharmacy business that provides pharmaceutical services only for those patients qualifying for the full concession price for medications under the Pharmaceutical Benefits Scheme (PBS). The pharmacy also sells regular retail products complementary to such a business.
Because the Australian government is currently implementing changes to the PBS Christina would like to model the monthly profit/loss position of the business, using approximate figures from the previous year (i.e. rounded). She has asked you to help her out!
Requirement:
Your task is to design a spreadsheet projection for Christina using the data she has provided. It will list anticipated income and costs arriving at appropriate totals that show the monthly profit profile for a period of one calendar year. The profit/loss figure for each month should be calculated as well as a cumulative balance over the twelve months. Allow maximum flexibility so that changes can easily be made. Your layout of the spreadsheet should be in a neat, easy to follow manner.
The following lookup table is to be used in your solution and shows the anticipated sales of prescriptions and retail items, the government refunds along with the wholesale costs for prescription and retail products.
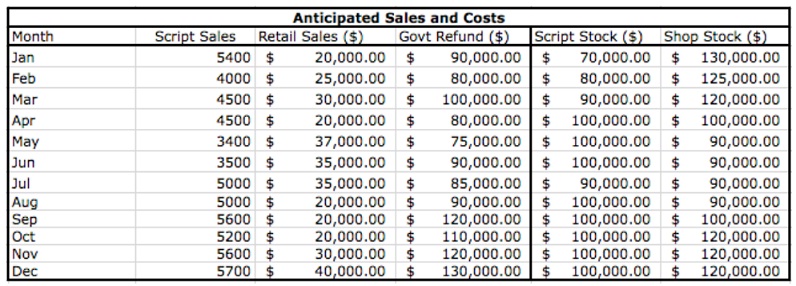
All prescriptions are sold at the full concession PBS price of $5.90. Other income includes a single payment of $2000 at the beginning of the year for provision of Professional Services, the monthly retail sales and the government refunds as provided in the lookup table.
Costs included in the monthly profit profile in addition to the wholesale costs of prescription and retail stock are fixed costs of $12,000 pa and variable costs factored at 5% of the business’ monthly income. When the number of script sales exceeds 5000 in a month an extra staff member is casually hired for the following month costing $2,000. After June this amount will rise by 2.5% when a national wage increase is implemented.
The income and costs to be included in the projections in are summarised below and should be included in a key values lookup table in your solution.
Income
Professional Services $2000 per year
Cost of a prescription (Concessional) $5.90 per medication
Costs
Fixed cost per annum $12,000.00
Variable costs per month 5% of total monthly income
Extra staff wages (If sales > 5000) $2,000.00 per month
Wages increase 2.5% of monthly salary
Hand in:
1) A copy of the display view of your projection (including the key values and lookup table). This should be printed with gridlines and row & column headings. To do this, go to the Page Layout tab and under the Print Titles option of Page Setup group, ensure Gridlines and ‘Row and column headings’ are checked for the Print option under the Sheet tab.
2) A copy of the formula view of your projection (not including the key and data tables). Choose the Formulas tab and click on the Show Formulas option found in the Formula Auditing group (You may then need to widen some columns.) You only need to print a section (selection) of your worksheet to show an example of each of the general formulae used.
3) Two separate graphs, one showing any profit or loss made over the twelve months, another showing the breakdown of one month’s expenses.
4) The summary sheet for a ‘What If’ analysis using Excel’s Scenario Manager to investigate:
a) the effects of Fixed costs rising to $20,000 and Variable costs increasing to 12%
b) the effects of discovering that Government refunds are about $20, 000 lower than expected and are as given below:
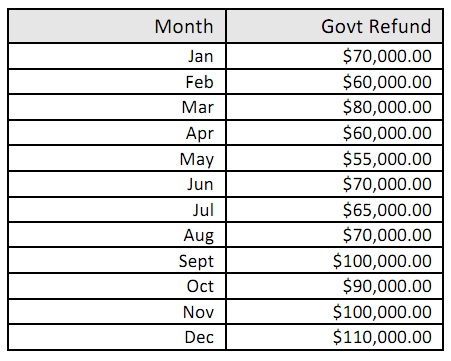
The resultant table should be formatted so that results can be easily interpreted.
Part B: Calculating Dosages
Introduction:
For the antibiotic Gentamicin Mary Boromeo, Community Pharmacist explains:
“Gentamicin is a powerful antibiotic, used almost exclusively in the hospital setting when lesser drugs have failed to control the infection eg in multi resistant bacterial strains. It is powerful but has toxic side effects and only a narrow therapeutic range - ie the gap between ineffective dose and over dose is small, hence it is imperative the correct dose is given for safe effective outcomes.
The individual's kidney function gives us access to determining the appropriate dose for each person. Creatinine is expelled from the body via the kidneys, its level in the blood (serum) will indicate kidney function - good or poor - so its rate of clearance (pharmacokinetics!) can be used to establish safe drug doses. You calculate the clearance by that formula and then use the spreadsheet to determine the dose.
The mathematical formula includes a mathematical constant and a serum reading for creatinine (easily measured by blood test) which is then mathematically adjusted for age, weight and sex. (pharmacodynamics at work). In these "nasty" drugs it is imperative the dose suits the individual hence the dosing spreadsheet.”
Requirement:
You are to create the lookup data tables and input output tables for steps 1 and 2 of the process for calculating dosages for the administration of Gentamicin to adults, i.e. calculating the body weight and applying the creatinine clearance estimation formula. The steps (after obtaining the patient’s name, sex and date of birth) are:
Step 1: IDEAL BODY WEIGHT CALCULATION
• Obtain patient's weight (kg) and height (feet)
• Calculate Ideal Body Weight (IBW): IBW = (males: 50 kg, females: 45.5 kg + 2.3 kg for every inch over 5 feet)
• Use ideal body weight (IBW) if the patient is obese, actual body weight if underweight.
Step 2: CREATININE CLEARANCE ESTIMATION
• Obtain serum creatinine (micro mol/L)
• Calculate creatinine clearance: CREATININE CLEARANCE ESTIMINATION = (140 - age (years)) * ideal body weight (Kg) * sexFactor (1.23 male, 1.04 female))/Serum Creatinine (micro mol/L)
Your input/output tables could look something like (designer’s licence allowed!) below:
For your input table apply validation to the input cells to limit the values entered to valid values (30 character limit for name), “Male” or “Female” values for sex and appropriate ranges for age, weight and serum creatinine.
You will create two lookup tables: an “Ideal body weight” and a small “Sex factor” table.
Your “Ideal body weight” lookup data table should look like the example from the lecture.
Your sex factor lookup table should need no explanation! These tables should be placed on a separate sheet of your Excel workbook.
Hand in:
1) A copy of the display of your data tables for “Ideal body weight” and “Sex factor”. This should be printed with gridlines and row & column headings. To do this, go to the Page Layout tab and under the Print Titles option of Page Setup group, ensure Gridlines and ‘Row and column headings’ are checked for the Print option under the Sheet tab.
2) A copy of the display view of your input and output tables with values displayed in the cells, i.e. manually entered values for the input table, generated values from formulas for the output table. Use the above display view input/output tables as a guide.
3) A copy of the formula view of your input and output tables. Choose the Formulas tab and click on the Show Formulas option found in the Formula Auditing group (You may then need to widen some columns.)
4) Screen shots of validation applied to the input cells: name, sex, date-of-birth, height, weight and serum creatinine. For example, the following shows data validation applied to the cell for entering the sex choice.