Complete the following:
1. An auto supply store uses a fixed order size with safety stock system to control the inventory of a type of motor oil it sells. Demand for the oil averages 20 units per day (7300 units per year) and the standard deviation of the daily demand is 4.3 units. For this item, the cost of placing each order is $35. The store purchases the oil at a price of $10 per unit and the annual holding cost is 27% of the purchase price.
a) What is the economic order quantity (EOQ) for this item?
b) Calculate the total annual cost (purchase, ordering, and holding) if the store uses EOQ as its order size.
c) The lead time for ordering the oil is 14 days. The store wants the probability of not running out during lead time to be 0.90 (i.e., cycle service level=0.90). what should the reorder point be?
2. Toppers Food Market is an up-scale supermarket with its own in-store bakery. Every morning, Toppers must decide how many trays of its specialty bread to bake. Toppers earns a profit of $15.40 on each tray of bread they can sell on the day it is baked. Bread not sold on the day it is baked is discarded and Toppers incurs a loss of $6.60 per tray of bread they have to discard. Estimates of the daily demand of fresh bread are given in the table below.
How many trays of bread should toppers bake each morning?
|
Demand
(Trays)
|
Probability of Selling
Exactly N Trays
|
|
5
|
0.20
|
|
6
|
0.20
|
|
7
|
0.25
|
|
8
|
0.15
|
|
9
|
0.15
|
|
10
|
0.05
|
|
11
|
0.00
|
3. A firm makes two end products. Product A is assembled from 3 units of component C and 1 unit of component E. Product B is assembled from 1 unit of component C and 2 units of component D. Each unit of component D is assembled from 2 units of E.
a) Draw the product structure trees from A and B.
b) Using the information below, complete the MRP schedules for all items. Note all of the Gross Requirements for end products A and B are shown in their schedules.
|
Item
|
On Hand
|
Lead Time
|
Lot Sizing Rule
|
|
A
|
25
|
2 weeks
|
FOQ = 50
|
|
B
|
0
|
1 week
|
Lot for Lot
|
|
C
|
200
|
3 weeks
|
FOQ = 200
|
|
D
|
0
|
1 week
|
Lot for Lot
|
|
E
|
10
|
1 week
|
FOQ = 50
|
|
|
|
|
|
|
Week
|
|
|
|
|
|
|
1
|
2
|
3
|
4
|
5
|
6
|
7
|
|
|
Gross Req'ts
|
|
|
|
|
30
|
10
|
|
|
A
|
On Hand
|
|
|
|
|
|
|
|
|
|
Net Req'ts
|
|
|
|
|
|
|
|
|
|
P.O. Receipts
|
|
|
|
|
|
|
|
|
|
P.O. Releases
|
|
|
|
|
|
|
|
|
|
Gross Req'ts
|
|
|
|
20
|
|
|
10
|
|
|
On Hand
|
|
|
|
|
|
|
|
|
B
|
Net Req'ts
|
|
|
|
|
|
|
|
|
|
P.O. Receipts
|
|
|
|
|
|
|
|
|
|
P.O. Releases
|
|
|
|
|
|
|
|
|
|
Gross Req'ts
|
|
|
|
|
|
|
|
|
|
On Hand
|
|
|
|
|
|
|
|
|
C
|
Net Req'ts
|
|
|
|
|
|
|
|
|
|
P.O. Receipts
|
|
|
|
|
|
|
|
|
|
P.O. Releases
|
|
|
|
|
|
|
|
|
|
Gross Req'ts
|
|
|
|
|
|
|
|
|
|
On Hand
|
|
|
|
|
|
|
|
|
D
|
Net Req'ts
|
|
|
|
|
|
|
|
|
|
P.O. Receipts
|
|
|
|
|
|
|
|
|
|
P.O. Releases
|
|
|
|
|
|
|
|
|
|
Gross Req'ts
|
|
|
|
|
|
|
|
|
|
On Hand
|
|
|
|
|
|
|
|
|
E
|
Net Req'ts
|
|
|
|
|
|
|
|
|
|
P.O. Receipts
|
|
|
|
|
|
|
|
|
|
P.O. Releases
|
|
|
|
|
|
|
|
4. A printing company has five printing jobs to process through its largest printing press. The processing times and due dates for the five jobs are shown in the following table. The firm operates seven days per week.
|
Job
|
Processing Time
(days)
|
Due Date
(days hence)
|
|
A
|
13
|
15
|
|
B
|
8
|
20
|
|
C
|
2
|
5
|
|
D
|
15
|
25
|
|
E
|
5
|
30
|
The firm's objective is to minimize the average tardiness for this set of jobs.
Note: the term tardiness is used here , rather than lateness, to indicate that there is no credit for a job completed early. A job completed before its due date simply has tardiness value of zero. In other words, lateness and tardiness are the same if the job is completed after the due date, but different if the job is completed before the due date.
a) Schedule the jobs using the earliest due date (EDD) priority rule and calculate the resulting mean tardiness for this set of jobs.
b) Schedule the jobs using the slack time remaining (STR) priority rule and calculate the resulting mean tardiness for this set of jobs.
c) Which of the two priority rules was best in this particular case?
5. A firm sells 30 kilogram bags of Portland cement to Home Depot and other retailers who sell them to small contractors and do it yourselves. Automatic machinery is used to fill the bags. Periodically, samples of size 8 are taken from the filling line and carefully weighed. While the process was in control, the average of the sample means was found to be 31.42 kilograms and the average of the sample ranges was found to be 0.81 kilograms
|
N
|
A2
|
D4
|
D4
|
N
|
A2
|
D3
|
D4
|
|
2
|
1.88
|
0
|
3.27
|
7
|
0.42
|
0.08
|
1.92
|
|
3
|
1.02
|
0
|
2.57
|
8
|
0.37
|
0.14
|
1.86
|
|
4
|
0.73
|
0
|
2.28
|
9
|
0.34
|
0.18
|
1.82
|
|
5
|
0.58
|
0
|
2.11
|
10
|
0.31
|
0.22
|
1.78
|
|
6
|
0.48
|
0
|
2.00
|
11
|
0.29
|
0.26
|
1.74
|
Calculate 3σ control limits for mean and range charts to monitor the filling process.
6. An insurance firm is concerned about the number of claims forms with missing or incorrect information. Analysis of a large number of forms has shown that 8.4% of the forms are defective in some way. To monitor the process, a sample of 300 forms will be taken each day and checked for errors.
a) Calculate 3 σ control limits for a P-chart to monitor the process.
b) The numbers of defective forms found in the five most recent samples are given in the following table. Complete the chart. Plot the results of the five samples.
|
Sample #
|
1
|
2
|
3
|
4
|
5
|
|
Number of Defective Forms
|
33
|
18
|
30
|
9
|
27
|
1 2 3 4 5
c) Is the process in control?
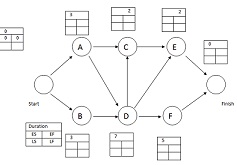
7. Analyze and solve the following project network. The numbers in the top line of the boxes represent the time in days required to perform each activity.
a) Using the two-step procedure consisting of forward and backward passes; determine how long it will take to complete the entire project.