Use the data in the chart to answer the questions below. The data indicates the number of "sick days" appliance installers take during a three month period, and the number of complaints filed by customers during the same interval. Use the Analysis Toolpak in Excel to perform simple regression and answer the questions.
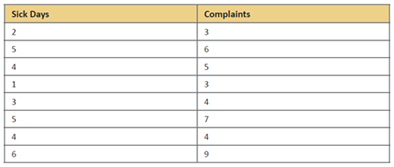
- Is the correlation between number of sick days and number of customer complaints statistically significant?
- What is the best prediction for the number of complaints that will be registered for an installer who takes five sick days during the period?