Assignment
PROBLEM 1
State Coverage Insurance Company inspect their claim forms periodically for errors. Their goal is to have zero errors on any of their claim forms. If one or more errors are found within a form, it is considered noncomforming. The company would like to use statistical process control to determine if there is a lot of variation present in the process used to complete the forms. Over the course of the last 25 working day, 125 forms were inspected each day and the number of forms with errors (i.e., nonconforming forms) were recorded. The table below provides the number of nonconforming forms found each day. Use the data to answer the following questions. Carry calculations out to at least 3 decimal places. Show your work.
(1) What is type of control chart(s) should be constructed based on the data provided in the table below on the left (i.e., c, p, X-bar, and/or R)?
(2) What is the central limit for this data?
(3) What are the 3-sigma upper and lower control limits?
(4) Construct the control chart showing not only the control limits but also the zone lines for the pattern test. Label the zones on the chart itself and identify the top and bottom border of each zone by completing the table below on the right. Note: The control chart may be created in Excel but a copy of it should be embedded as a picture in your test document. Make sure it is large enough to read all elements.
(5) State whether or not the process appears to be in control? Were any pattern test violations found? If so, identify them (name the pattern and which points fit the pattern).
|
DATA COLLECTED
|
|
Day
|
# Nonconforming
|
|
1
|
2
|
|
2
|
1
|
|
3
|
2
|
|
4
|
3
|
|
5
|
0
|
|
6
|
8
|
|
7
|
6
|
|
8
|
4
|
|
9
|
7
|
|
10
|
3
|
|
11
|
6
|
|
12
|
8
|
|
13
|
0
|
|
14
|
5
|
|
15
|
4
|
|
16
|
3
|
|
17
|
6
|
|
18
|
0
|
|
19
|
4
|
|
20
|
4
|
|
21
|
0
|
|
22
|
7
|
|
23
|
8
|
|
24
|
4
|
|
25
|
5
|
|
ZONE INFORMATION TABLE
|
|
Zone
|
Top boarder
|
Bottom boarder
|
|
A top
|
|
|
|
B top
|
|
|
|
C top
|
|
|
|
C bottom
|
|
|
|
B bottom
|
|
|
|
A bottom
|
|
|
PROBLEM 2
The GS Electronics Company produces a variety of appliances. One of their most popular appliance is a large side-by-side refrigerator/freezer. Orders have been received from five retailers in 5 different cities to purchase these appliances during the next week. The appliances will be shipped individually from factories located in different cities. The table below shows what the cost will be for shipping each appliance from each of 4 GS factories to each retailor. The table also shows how many appliances have been ordered by each customer and how many will be produced by each factory. The company's distribution manager now wants to determine how many appliances to ship from each factory to each retailor to minimize the total shipping cost.
|
From/To
|
Shipping Cost for Each Appliance
|
Output (units)
|
|
Charlotte Retailer
|
Atlanta Retailer
|
Chicago Retailer
|
Dallas Retailer
|
San Diego Retailer
|
|
Omaha Factory
|
$120
|
$140
|
$70
|
$85
|
$100
|
12
|
|
Kansas City Factory
|
$100
|
$105
|
$65
|
$110
|
$150
|
15
|
|
Denver Factory
|
$165
|
$170
|
$120
|
$80
|
$90
|
10
|
|
Cincinnati Factory
|
$95
|
$100
|
$30
|
$140
|
$170
|
8
|
|
Order Size (units)
|
9
|
13
|
11
|
7
|
5
|
|
(1) Draw the network diagram for this problem showing all of the data provided in the table above.
(2) Write out the LP model for this problem. Be sure to define your variables up front.
(3) Set up the LP model in Excel and solve for the optimal solution (Note: Be sure to explicitly state what the optimal solution and the associated objective function value are in your test document).
PROBLEM 3
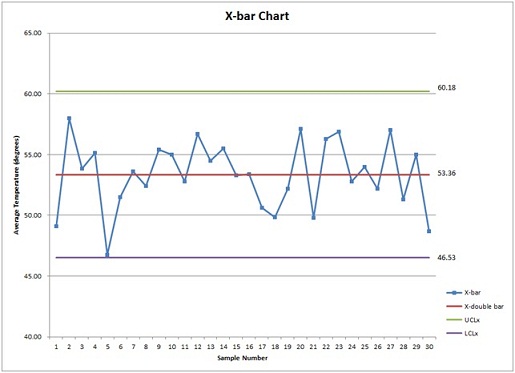
Just Right Incorporated manufactures a device for monitoring and controlling the room temperatures in large institutions. The device takes readings of the temperature in multiple spaces (classrooms, offices, auditoriums, closets, storage areas, etc.) in buildings across the institution. For one institution using these devices, Clendon University, when the outside temperature rises above 60° the air conditioning mode is activated. When the outside temperature drops below 50°, the heating mode is activated. When the outside temperature is between 50° and 60°, the system is expected to remain in "neutral" mode. However, recently Just Right Inc. has been receiving complaints from Clendon University stating that even when the system is set to these predetermined temperatures, the actual temperature in the spaces are often much lower or much higher than the room setpoints (between 50° and 60°). Because of this, high heating/cooling costs are being incurred due to lack of control in the building HVAC systems or room thermostats. In order to investigate the validity of these complaints, Just Right's product manager decided to launch a project to determine whether the devices were experiencing excessive variation and if the devices were capable of meeting the customer specifications. Below is the control chart (based on 3 sigma control limits) that was created when 30 samples of 5 temperature readings each were taken at Clendon University.
(1) If the customer specification is 55 degrees ± 5 degrees, calculate Cp and Cpk to determine if the process capable of meeting the customer specification? Round calculations to 3 decimal places. Show your work.
(2) Express whether or not the process is capable and provide a thorough interpretation of your results.
PROBLEM 4
Manikas Electronics is a US-based company that manufactures cell phone components sold to companies worldwide. The founder and CEO of the company, who is a Greek native, wants to build a new warehouse and distribution center in Greece to help the country recover more quickly from the economic crisis experienced around 2009. The company has identified potential sites in the port cities of Drapetsona, Piraeus, Aspropyrgos, Keratsini, and Eleusis. Each site was graded from 0 = worst to 100 = best based upon 10 location factors. The following table shows the grade each location received for the factors associated with the location decision. The weights depicting the importance of each location factor are not provided.
(1) Determine what you believe these weights should be. Explain and justify your weights.
(2) Based on your weights and the data provided, which location would you recommend for the new distribution center and why? Show your work.
|
Location Factors
|
Port Scores (0 to 100)
|
|
Drapetsona
|
Piraeus
|
Aspropyrgos
|
Keratsini
|
Eleusis
|
|
Economic Stability
|
70
|
90
|
80
|
85
|
65
|
|
Infrastructure
|
80
|
95
|
70
|
65
|
80
|
|
Facility cost
|
75
|
55
|
90
|
80
|
65
|
|
Labor availability
|
65
|
70
|
80
|
85
|
70
|
|
Container availability
|
80
|
85
|
75
|
66
|
70
|
|
Labor rates
|
70
|
60
|
95
|
85
|
75
|
|
Transportation
|
65
|
90
|
75
|
75
|
75
|
|
Duties, tariffs, and fees
|
80
|
70
|
90
|
80
|
75
|
|
Expansion/modernization
|
75
|
95
|
80
|
90
|
80
|
|
Trade regulations
|
75
|
75
|
80
|
80
|
65
|
PROBLEM 5
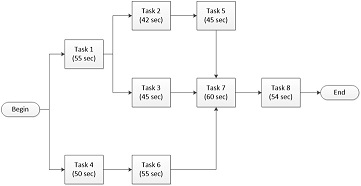
Zoomster Inc. must build an assembly line for their new line of electric scooters. The current marketing forecasts suggest that 400 scooters should be produced per day. The production facility runs two 8-hour shifts per day. The assembly process steps and their precedences are shown in the diagram below. Round calculations to 2 decimal places.
(1) If the production facility operates 260 days per year, what is the cycle time required to meet the forecasted demand?
(2) What is the theoretical number of workstations?
(3) Build the most efficient assembly line possible by assigning each task to a workstation. Show the assignments.
(4) What is the efficiency of the assembly line?
Note: Be sure to show all of your work, express the units associated with your answers, and circle your final answers.
Format your assignment according to the following formatting requirements:
(1) The answer should be typed, double spaced, using Times New Roman font (size 12), with one-inch margins on all sides.
(2) The response also includes a cover page containing the title of the assignment, the student's name, the course title, and the date. The cover page is not included in the required page length.
(3) Also include a reference page. The Citations and references should follow APA format. The reference page is not included in the required page length.