Assignment:
Instructions
For this assignment you will be engaging in empirical work--that is, you will be collecting, compiling, and reporting the results of a brief interview with a knowledgeable person at a particular business of your choosing. The purpose of this research is to learn about how businesses are structured, how they perceive their environment, and how they behave. Specifically, you will be interested in learning the nature of the business and the market it operates in, and its sales, costs, and pricing.
The list under Information to Collect below indicates the information you are to collect by interviewing a knowledgeable person who owns or works at a business. You will speak with this person (face-to-face, by phone, by email, or whatever works best), collect this information to the fullest extent possible, compile the information, and submit your research when it is complete.
Information to Collect
The information you will be collecting in your interview falls into three categories as given below.
1. Nature of the Business and its Market(s)
• Size of business (in terms of number of employees, annual revenues, or whatever is most appropriate)
• Product(s) sold--could be a good or a service.
• Degree of competition. For instance, is the market very competitive, somewhat competitive, or does this business hold a near monopoly in the market?
• Form(s) of competition. Does the business compete mainly in terms of low prices, marketing, product innovations, or something else?
2. Sales, Costs, and Prices
• How variable are sales? For instance, 'fairly stable from week to week, but some months are better than others', versus 'sales fluctuate on a daily basis', versus sales are stable over long periods of time (perhaps to due long term contracts or other factors).
• What are the primary reasons for fluctuations in sales?
• How variable is/are the price(s) of the product(s) the business sells? For instances, does the business change its price(s) daily, monthly, yearly, or longer?
• What are the primary reasons for changes in price?
• How do average (that is, per unit) costs change when the business is producing more of its product in a given period versus when it's producing less, versus somewhere in the middle.
o Note: this last question may be a bit tricky. You want to know about what economists usually call average total costs, though different terms are often used in business. Whatever the preferred term, what you're looking at is the total costs of production in whatever the relevant time period is divided by the quantity being produced.
More specifically, you want to know whether the average cost of production goes up or down (or down, then back up, and so on) when the business is producing more units versus fewer. Again, the business doesn't need to share any actual dollar values if they don't want to in order to answer this question. You're just looking for the change over different levels of production (output).
o Here's a completely hypothetical example with made-up numbers to make this clearer. Suppose a restaurant owner is thinking in terms of week-to-week operations. In a typical week, the restaurant serves, say, 2,000 meals. Her costs include, say $5,000 to servers, cooks, management and so on, and $8,000 for ingredients for the meals. Her monthly utilities and rent come out to around $12,000, so one week's worth is about $3,000.
Hence, her total costs for the week are $16,000 and her average total costs come out to 16,000/2,000 = 8 dollars per meal. Now, we don't need to know that dollar figure, though it's fine to report it if the interviewee is comfortable sharing it. What we want to know is: when sales are lower than typical (on a slow week) do average costs go up or down? Likewise, when sales are higher (a good week) do average costs go up or down.
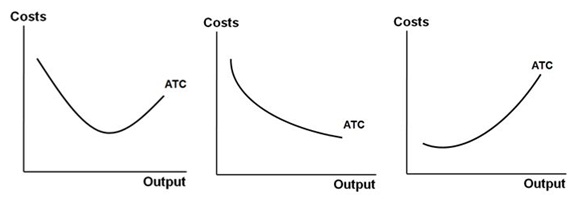
o The curves below give the three most basic possibilities for this question. In the graph on the left, average total cost first declines as output increases, but then bottoms out and starts to increase after some lowest-average-cost level of production. The graph in the center indicates that average cost simply decreases as output increases; while the graph on the right indicates that average cost simply increases.